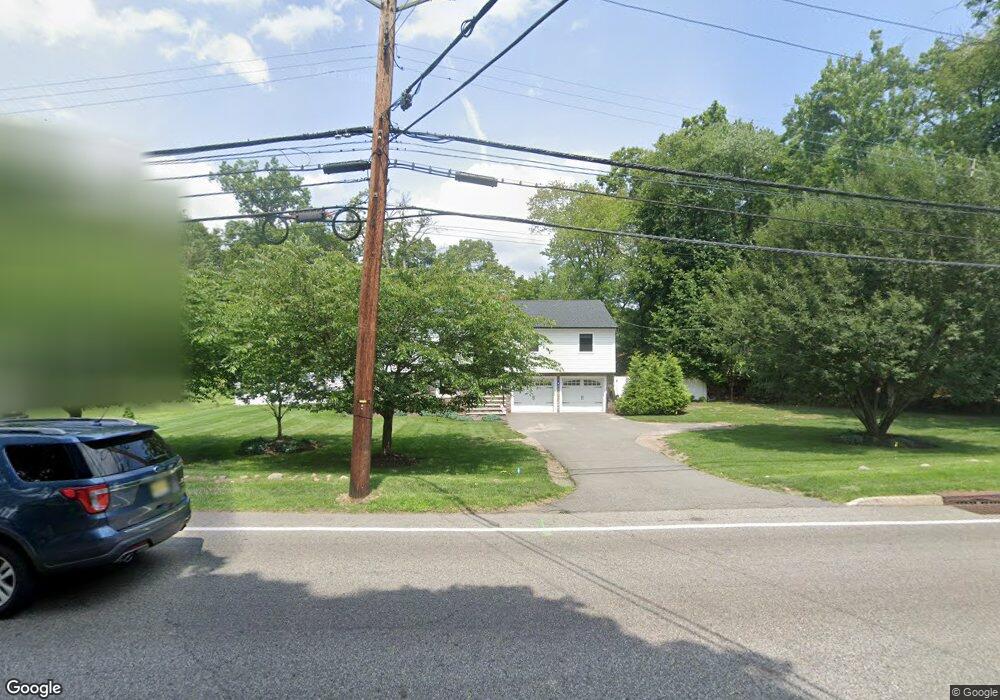
309 Wyckoff Ave Waldwick, NJ 07463
Estimated Value: $830,000 - $994,000
--
Bed
--
Bath
1,846
Sq Ft
$486/Sq Ft
Est. Value
About This Home
This home is located at 309 Wyckoff Ave, Waldwick, NJ 07463 and is currently estimated at $896,444, approximately $485 per square foot. 309 Wyckoff Ave is a home located in Bergen County with nearby schools including Waldwick High School, The Village School - Montessori, and Waldwick Seventh-Day Adventist School.
Ownership History
Date
Name
Owned For
Owner Type
Purchase Details
Closed on
Sep 13, 2012
Sold by
Viganola John
Bought by
Mcbain Kevin M and Mcbain Kasey
Current Estimated Value
Home Financials for this Owner
Home Financials are based on the most recent Mortgage that was taken out on this home.
Original Mortgage
$459,553
Interest Rate
3.4%
Mortgage Type
FHA
Purchase Details
Closed on
Jun 22, 2012
Sold by
Wetzel Robert J and Rayot Raymond
Bought by
Viganola John
Create a Home Valuation Report for This Property
The Home Valuation Report is an in-depth analysis detailing your home's value as well as a comparison with similar homes in the area
Home Values in the Area
Average Home Value in this Area
Purchase History
| Date | Buyer | Sale Price | Title Company |
|---|---|---|---|
| Mcbain Kevin M | $476,900 | -- | |
| Viganola John | $250,000 | -- |
Source: Public Records
Mortgage History
| Date | Status | Borrower | Loan Amount |
|---|---|---|---|
| Previous Owner | Mcbain Kevin M | $459,553 |
Source: Public Records
Tax History Compared to Growth
Tax History
| Year | Tax Paid | Tax Assessment Tax Assessment Total Assessment is a certain percentage of the fair market value that is determined by local assessors to be the total taxable value of land and additions on the property. | Land | Improvement |
|---|---|---|---|---|
| 2025 | $17,367 | $784,400 | $344,400 | $440,000 |
| 2024 | $15,410 | $784,400 | $344,400 | $440,000 |
| 2023 | $15,092 | $529,900 | $295,000 | $234,900 |
| 2022 | $15,092 | $529,900 | $295,000 | $234,900 |
| 2021 | $14,805 | $529,900 | $295,000 | $234,900 |
| 2020 | $14,662 | $529,900 | $295,000 | $234,900 |
| 2019 | $14,657 | $529,900 | $295,000 | $234,900 |
| 2018 | $13,467 | $502,700 | $295,000 | $207,700 |
| 2017 | $13,352 | $502,700 | $295,000 | $207,700 |
| 2016 | $13,080 | $502,700 | $295,000 | $207,700 |
| 2015 | $12,929 | $502,700 | $295,000 | $207,700 |
| 2014 | $12,618 | $501,300 | $295,000 | $206,300 |
Source: Public Records
Map
Nearby Homes
- 1-5 Chestnut Place
- 103 Crescent Ave
- 39 Edgewood Ave
- 36 Lockwood Dr
- 20 van Schaik Ln
- 342 Park Ave
- 314 Meadowbrook Rd
- 53 Smithfield Rd
- 24 Scott Ct
- 137 Elmwood Place
- 16 Hemlock St
- 36 Hemlock St
- 34 4th St
- 22 Oakwood Rd
- 117 Spruce St
- 723 W Crescent Ave
- 190 Madison Ave
- 103 Macintyre Ln
- 65 New St
- 29 Westview Terrace