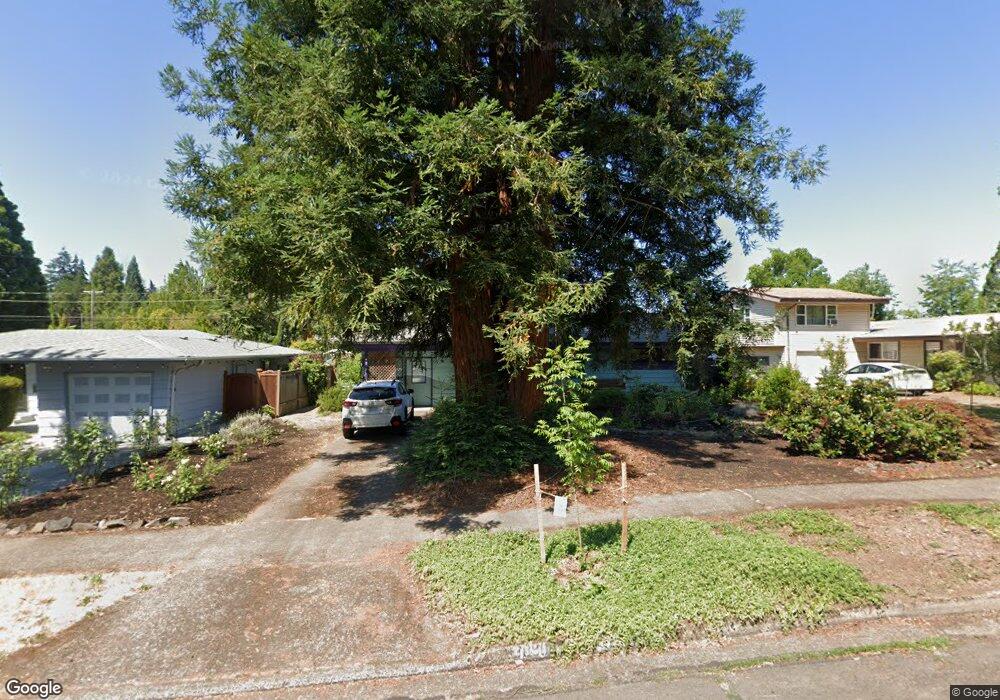
3090 Potter St Eugene, OR 97405
Southeast Eugene NeighborhoodEstimated Value: $384,000 - $491,000
3
Beds
1
Bath
1,080
Sq Ft
$405/Sq Ft
Est. Value
About This Home
This home is located at 3090 Potter St, Eugene, OR 97405 and is currently estimated at $437,260, approximately $404 per square foot. 3090 Potter St is a home located in Lane County with nearby schools including Camas Ridge Community Elementary School, Roosevelt Middle School, and South Eugene High School.
Ownership History
Date
Name
Owned For
Owner Type
Purchase Details
Closed on
Apr 17, 2015
Sold by
Gribskov Shawna K and Mcculloch Ronald J
Bought by
Desilva Nancy L
Current Estimated Value
Home Financials for this Owner
Home Financials are based on the most recent Mortgage that was taken out on this home.
Original Mortgage
$191,900
Outstanding Balance
$145,791
Interest Rate
3.7%
Mortgage Type
New Conventional
Estimated Equity
$291,469
Purchase Details
Closed on
Sep 30, 2010
Sold by
Gribskov Shawna K
Bought by
Gribskov Shawna K and Mcculloch Ronald J
Home Financials for this Owner
Home Financials are based on the most recent Mortgage that was taken out on this home.
Original Mortgage
$130,000
Interest Rate
4.35%
Mortgage Type
New Conventional
Purchase Details
Closed on
Sep 23, 2002
Sold by
Phillips Alan M
Bought by
Gribskov Shawna K
Create a Home Valuation Report for This Property
The Home Valuation Report is an in-depth analysis detailing your home's value as well as a comparison with similar homes in the area
Home Values in the Area
Average Home Value in this Area
Purchase History
| Date | Buyer | Sale Price | Title Company |
|---|---|---|---|
| Desilva Nancy L | $239,900 | Cascade Title Company | |
| Gribskov Shawna K | -- | Western Title & Escrow | |
| Gribskov Shawna K | -- | Evergreen Land Title Co |
Source: Public Records
Mortgage History
| Date | Status | Borrower | Loan Amount |
|---|---|---|---|
| Open | Desilva Nancy L | $191,900 | |
| Previous Owner | Gribskov Shawna K | $130,000 |
Source: Public Records
Tax History
| Year | Tax Paid | Tax Assessment Tax Assessment Total Assessment is a certain percentage of the fair market value that is determined by local assessors to be the total taxable value of land and additions on the property. | Land | Improvement |
|---|---|---|---|---|
| 2025 | $4,440 | $227,894 | -- | -- |
| 2024 | $4,385 | $221,257 | -- | -- |
| 2023 | $4,385 | $214,813 | $0 | $0 |
| 2022 | $4,108 | $208,557 | $0 | $0 |
| 2021 | $3,858 | $202,483 | $0 | $0 |
| 2020 | $3,872 | $196,586 | $0 | $0 |
| 2019 | $3,740 | $190,861 | $0 | $0 |
| 2018 | $3,520 | $179,905 | $0 | $0 |
| 2017 | $3,284 | $179,905 | $0 | $0 |
| 2016 | $3,160 | $174,665 | $0 | $0 |
| 2015 | $3,054 | $169,578 | $0 | $0 |
| 2014 | -- | $164,639 | $0 | $0 |
Source: Public Records
Map
Nearby Homes
- 790 E 32nd Ave
- 3031 Hummingbird Ln
- 3023 Hummingbird Ln
- 2815 Hilyard St
- 3605 Emerald St
- 2683 Alder St
- 3283 Stoney Ridge Rd
- 2630 Onyx St
- 585 E 36th Ave
- 0 Agate St
- 1180 E 37th Ave
- 555 Stafford Ct
- 310 1/2 E 31st Ave Unit 1
- 2571 Alder St
- 1820 E 28th Ave
- 1350 E 25th Ave
- 3817 E Amazon Dr
- 3790 Onyx St
- 1210 E 38th Ave
- 2580 Chula Vista Blvd
Your Personal Tour Guide
Ask me questions while you tour the home.