


3090 Twinleaf St Commerce Township, MI 48382
Estimated payment $2,149/month
Highlights
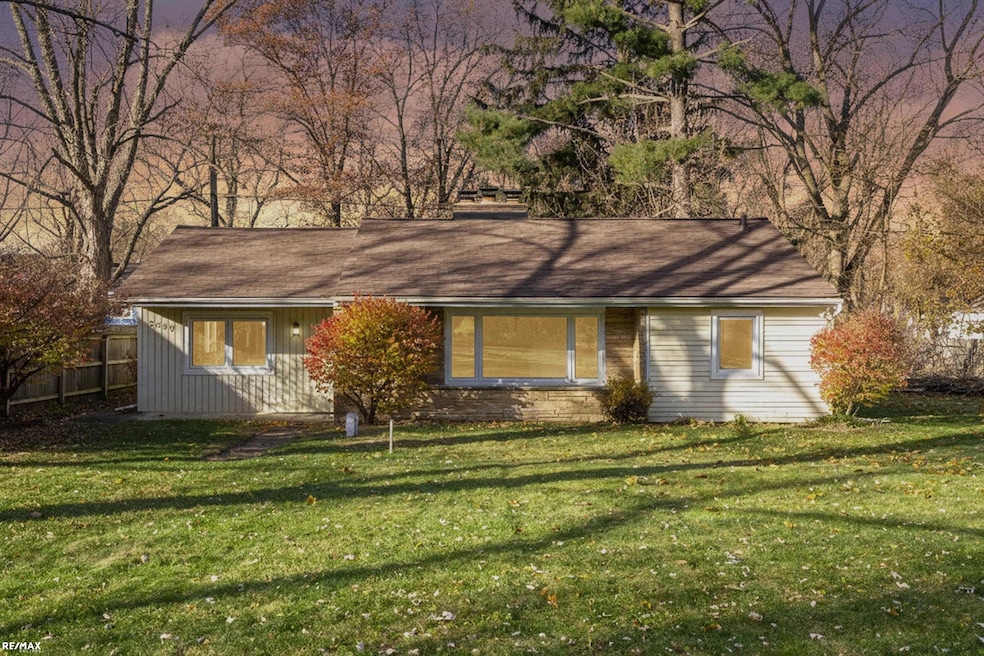
- Ranch Style House
- 4 Car Detached Garage
- Patio
- Commerce Elementary School Rated A
- Porch
- Forced Air Heating and Cooling System
About This Home
Discover easy, one-level living in this beautifully updated 3-bedroom ranch in Commerce Township, perfectly positioned on a spacious lot with private lake and beach access to Maple Pointe Beach on Lower Straits Lake. Enjoy all the perks of lake-access living without the waterfront price—just a short walk away with a low annual association fee of $50. This move-in ready home has seen extensive updates from 2021 through 2025, offering true peace of mind for today’s buyer. Improvements include a new roof and gutters, Weather Guard windows, updated flooring, new furnace and central air, new electrical panel, water softener, and a brand-new well (2025). The kitchen is both functional and welcoming, featuring newer appliances, including a refrigerator and stove, making everyday living and entertaining a breeze. A standout feature is the oversized four-car garage with convenient access from Arbutus Street—perfect for car enthusiasts, hobbyists, storage needs, a workshop, or even your lake toys and gear. Outside, the large lot provides plenty of space for outdoor entertaining, gardening, pets, or future expansion. Set in a lovely neighborhood with private beach privileges on Lower Straits Lake, this Commerce Township ranch delivers the perfect mix of comfort, convenience, and that sought-after Up North feel—right at home. With all the major updates already completed, all that’s left to do is move in, unpack, and start enjoying your lake-access lifestyle.
Home Details
Home Type
- Single Family
Est. Annual Taxes
Year Built
- Built in 1961
Lot Details
- 0.36 Acre Lot
- Lot Dimensions are 100 x 210
Parking
- 4 Car Detached Garage
Home Design
- Ranch Style House
- Brick Exterior Construction
- Slab Foundation
- Vinyl Siding
Interior Spaces
- 1,644 Sq Ft Home
- Family Room
- Living Room with Fireplace
Kitchen
- Oven or Range
- Disposal
Bedrooms and Bathrooms
- 3 Bedrooms
- 1 Full Bathroom
Laundry
- Dryer
- Washer
Outdoor Features
- Patio
- Porch
Utilities
- Forced Air Heating and Cooling System
- Heating System Uses Natural Gas
- Gas Water Heater
- Septic Tank
Community Details
- Maple Pointe Beach Sub Subdivision
Listing and Financial Details
- Assessor Parcel Number 17-11-404-010
Map
Home Values in the Area
Average Home Value in this Area
Tax History
| Year | Tax Paid | Tax Assessment Tax Assessment Total Assessment is a certain percentage of the fair market value that is determined by local assessors to be the total taxable value of land and additions on the property. | Land | Improvement |
|---|---|---|---|---|
| 2025 | $6,018 | $138,950 | $0 | $0 |
| 2024 | $4,382 | $132,420 | $0 | $0 |
| 2023 | $4,151 | $117,480 | $0 | $0 |
| 2022 | $5,335 | $109,830 | $0 | $0 |
| 2021 | $2,668 | $102,520 | $0 | $0 |
| 2020 | $1,110 | $94,900 | $0 | $0 |
| 2019 | $1,743 | $90,760 | $0 | $0 |
| 2018 | $1,724 | $75,100 | $0 | $0 |
| 2017 | $1,699 | $75,100 | $0 | $0 |
| 2016 | $1,678 | $72,220 | $0 | $0 |
| 2015 | -- | $67,070 | $0 | $0 |
| 2014 | -- | $57,890 | $0 | $0 |
| 2011 | -- | $45,360 | $0 | $0 |
Property History
| Date | Event | Price | List to Sale | Price per Sq Ft |
|---|---|---|---|---|
| 02/11/2026 02/11/26 | Pending | -- | -- | -- |
| 01/27/2026 01/27/26 | Price Changed | $320,000 | -3.0% | $195 / Sq Ft |
| 11/18/2025 11/18/25 | For Sale | $330,000 | -- | $201 / Sq Ft |
Purchase History
| Date | Type | Sale Price | Title Company |
|---|---|---|---|
| Quit Claim Deed | -- | None Listed On Document | |
| Deed | $150,000 | Premium Title Services Inc | |
| Sheriffs Deed | $153,920 | None Available | |
| Warranty Deed | $200,000 | -- |
Mortgage History
| Date | Status | Loan Amount | Loan Type |
|---|---|---|---|
| Open | $112,500 | New Conventional | |
| Previous Owner | $160,000 | Purchase Money Mortgage |
Source: Michigan Multiple Listing Service
MLS Number: 50194531
APN: 17-11-404-010
Disclaimer: Certain information contained herein is derived from information provided by parties other than Homes.com. All information provided is deemed reliable, but is not guaranteed to be accurate and should be independently verified.
![]() Source MLS: MiRealSource
Source MLS: MiRealSource
Provided through IDX via MiRealSource. Courtesy of MiRealSource Shareholder. Copyright MiRealSource.
The information published and disseminated by MiRealSource is communicated verbatim, without change by MiRealSource, as filed with MiRealSource by its members. The accuracy of all information, regardless of source, is not guaranteed or warranted. All information should be independently verified.
Copyright 2026 MiRealSource. All rights reserved. The information provided hereby constitutes proprietary information of MiRealSource, Inc. and its shareholders, affiliates and licensees and may not be reproduced or transmitted in any form or by any means, electronic or mechanical, including photocopy, recording, scanning or any information storage and retrieval system, without written permission from MiRealSource, Inc.
- 3099 Chenoa St
- 3302 Newton Rd
- 0 Listeria St
- 4615 S Commerce Rd
- 2602 Pinto Dr
- 8735 Ringwood Dr
- 144 Bobolink Ave
- 8723 Ringwood Dr
- 4659 Camelina St
- 000 Wise Rd
- 900 Polvadera St
- 8605 Edgewood Park Dr
- 9255 Richardson Rd
- Vacant Carroll Lake Rd
- 4975 Comstock St
- 0 Garthby St
- 8370 Arlis St
- 945 N Commerce Rd
- 2069 Alsup Ave
- 8304 Arlis St

Ask me questions while you tour the home.