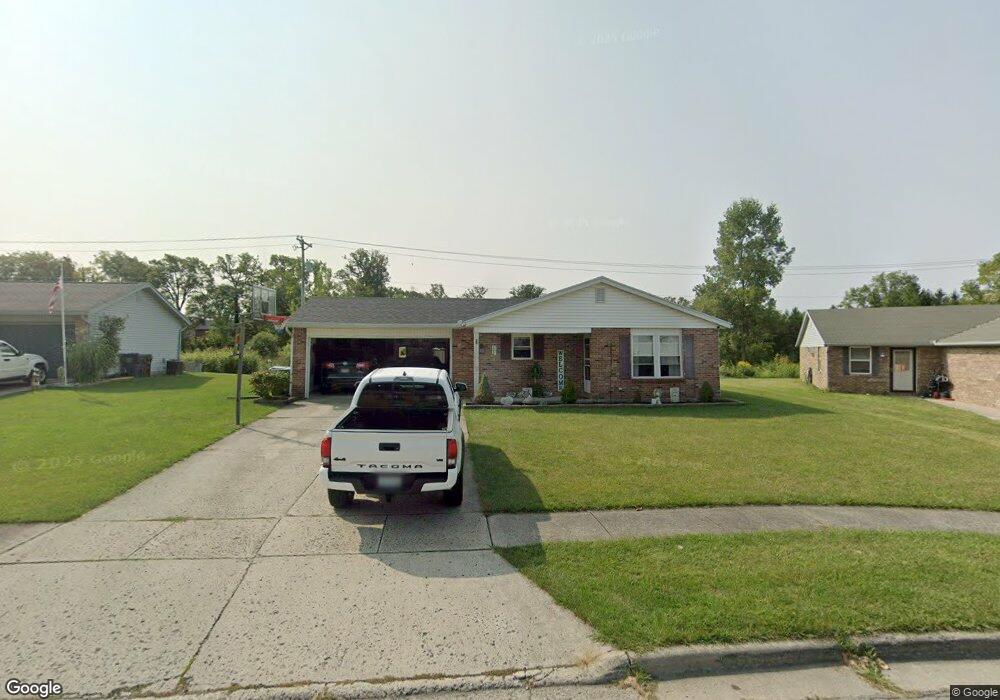
3091 Jenny Place Lima, OH 45805
Lakewood West NeighborhoodEstimated Value: $163,000 - $210,000
3
Beds
2
Baths
1,236
Sq Ft
$151/Sq Ft
Est. Value
About This Home
This home is located at 3091 Jenny Place, Lima, OH 45805 and is currently estimated at $186,831, approximately $151 per square foot. 3091 Jenny Place is a home located in Allen County with nearby schools including Maplewood Elementary School, Elmwood Elementary School, and Shawnee Middle School.
Ownership History
Date
Name
Owned For
Owner Type
Purchase Details
Closed on
May 11, 2020
Sold by
Market Jeffrey L and Market Jennifer S
Bought by
Market Jeffrey L and Market Jennifer S
Current Estimated Value
Home Financials for this Owner
Home Financials are based on the most recent Mortgage that was taken out on this home.
Original Mortgage
$73,500
Outstanding Balance
$49,898
Interest Rate
3.3%
Mortgage Type
Unknown
Estimated Equity
$136,933
Purchase Details
Closed on
Feb 15, 2008
Sold by
Lacy Development Corp
Bought by
Market Jeffrey L and Market Jennifer S
Home Financials for this Owner
Home Financials are based on the most recent Mortgage that was taken out on this home.
Original Mortgage
$83,300
Interest Rate
6.11%
Mortgage Type
Purchase Money Mortgage
Purchase Details
Closed on
Apr 4, 1989
Bought by
Lacy Development Corp
Create a Home Valuation Report for This Property
The Home Valuation Report is an in-depth analysis detailing your home's value as well as a comparison with similar homes in the area
Home Values in the Area
Average Home Value in this Area
Purchase History
| Date | Buyer | Sale Price | Title Company |
|---|---|---|---|
| Market Jeffrey L | -- | None Available | |
| Market Jeffrey L | $84,000 | Attorney | |
| Lacy Development Corp | $124,000 | -- |
Source: Public Records
Mortgage History
| Date | Status | Borrower | Loan Amount |
|---|---|---|---|
| Open | Market Jeffrey L | $73,500 | |
| Closed | Market Jeffrey L | $83,300 |
Source: Public Records
Tax History
| Year | Tax Paid | Tax Assessment Tax Assessment Total Assessment is a certain percentage of the fair market value that is determined by local assessors to be the total taxable value of land and additions on the property. | Land | Improvement |
|---|---|---|---|---|
| 2024 | $1,663 | $40,890 | $7,320 | $33,570 |
| 2023 | $1,379 | $30,520 | $5,460 | $25,060 |
| 2022 | $1,389 | $30,520 | $5,460 | $25,060 |
| 2021 | $1,397 | $30,520 | $5,460 | $25,060 |
| 2020 | $1,083 | $24,290 | $5,180 | $19,110 |
| 2019 | $1,083 | $24,290 | $5,180 | $19,110 |
| 2018 | $1,079 | $24,290 | $5,180 | $19,110 |
| 2017 | $1,102 | $24,290 | $5,180 | $19,110 |
| 2016 | $1,093 | $24,290 | $5,180 | $19,110 |
| 2015 | $1,106 | $24,290 | $5,180 | $19,110 |
| 2014 | $1,106 | $24,400 | $5,360 | $19,040 |
| 2013 | $1,084 | $24,400 | $5,360 | $19,040 |
Source: Public Records
Map
Nearby Homes
- 2997 Cletus Pkwy
- 250 Squire Ln
- 3071 Canterbury Dr
- 0 Springview Dr
- 2921 Canterbury Dr
- 1408 Winghaven Dr
- 3360 Springview Dr
- 3390 Spencerville Rd
- 2964 Hanover Dr
- 2949 Lakewood Ave
- 1453 W Shore Dr
- 1421 Shawnee Rd
- 1540 Adak Ave
- 2802 Lowell Ave
- 206 Eagles Point St E
- 123 Eagles Point W
- 2700 Lowell Ave
- 1409 Fulton Rd
- 2072 Arcadia Ave
- 1635 Tanglewood Ln
- 3071 Jenny Place
- 1180 Westerly Dr
- 3051 Jenny Place
- 3070 Jenny Place
- 1170 Westerly Dr
- 3060 Jenny Place
- 3031 Jenny Place
- 3050 Jenny Place
- 3091 Elijah Pkwy
- 3011 Jenny Place
- 3071 Elijah Pkwy
- 3030 Jenny Place
- 2916 Autumn Leaves Ct
- 3031 Elijah Pkwy
- 2946 Autumn Leaves
- 1120 Westerly Dr
- 1140 Westerly Dr
- 3000 Jenny Place
Your Personal Tour Guide
Ask me questions while you tour the home.