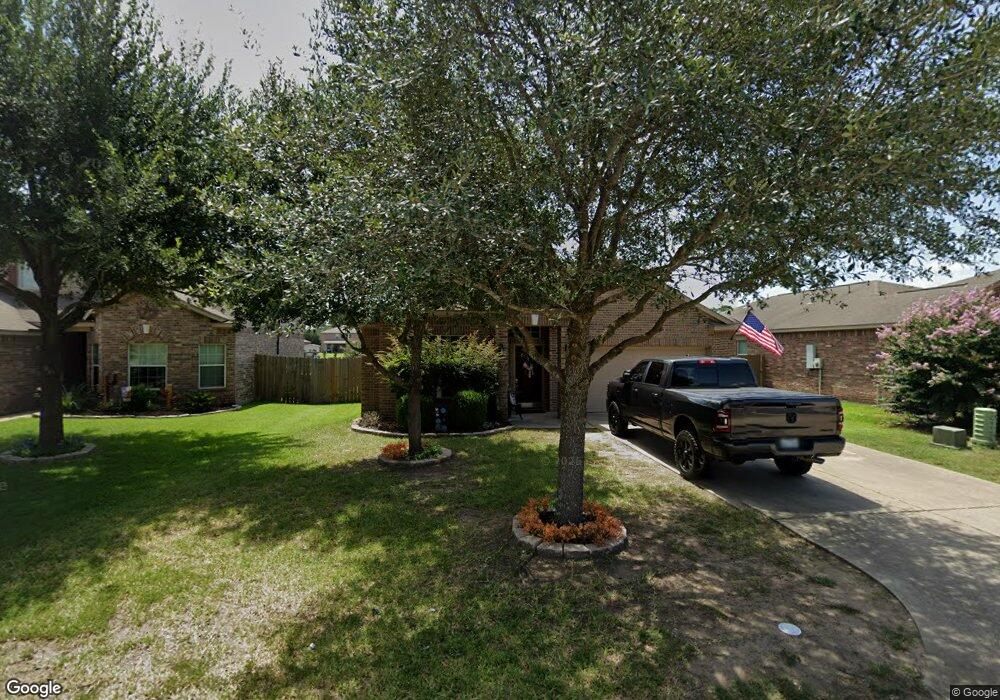
30918 W Lost Creek Blvd Magnolia, TX 77355
Estimated Value: $273,417 - $428,000
--
Bed
--
Bath
2,097
Sq Ft
$155/Sq Ft
Est. Value
About This Home
This home is located at 30918 W Lost Creek Blvd, Magnolia, TX 77355 and is currently estimated at $324,104, approximately $154 per square foot. 30918 W Lost Creek Blvd is a home with nearby schools including Magnolia Elementary School, Magnolia Sixth Grade Campus, and Magnolia Junior High School.
Ownership History
Date
Name
Owned For
Owner Type
Purchase Details
Closed on
Jun 23, 2015
Sold by
Lee John
Bought by
Lee John C and Lee Janet L
Current Estimated Value
Home Financials for this Owner
Home Financials are based on the most recent Mortgage that was taken out on this home.
Original Mortgage
$170,489
Outstanding Balance
$132,751
Interest Rate
3.9%
Mortgage Type
FHA
Estimated Equity
$191,353
Purchase Details
Closed on
Sep 20, 2013
Sold by
Lgi Homes Lakes Of Magnolia Llc
Bought by
Lee John
Home Financials for this Owner
Home Financials are based on the most recent Mortgage that was taken out on this home.
Original Mortgage
$172,713
Interest Rate
4.46%
Mortgage Type
FHA
Purchase Details
Closed on
Oct 12, 2012
Sold by
Dci Of Magnolia Inc
Bought by
Lee John C and Lee Janet L
Purchase Details
Closed on
May 13, 2011
Sold by
Lajolla Land Company
Bought by
Lee John C and Lee Janet L
Create a Home Valuation Report for This Property
The Home Valuation Report is an in-depth analysis detailing your home's value as well as a comparison with similar homes in the area
Home Values in the Area
Average Home Value in this Area
Purchase History
| Date | Buyer | Sale Price | Title Company |
|---|---|---|---|
| Lee John C | -- | Chicago Title | |
| Lee John | -- | Texas American Title Company | |
| Lee John C | -- | -- | |
| Lee John C | -- | -- |
Source: Public Records
Mortgage History
| Date | Status | Borrower | Loan Amount |
|---|---|---|---|
| Open | Lee John C | $170,489 | |
| Closed | Lee John | $172,713 |
Source: Public Records
Tax History Compared to Growth
Tax History
| Year | Tax Paid | Tax Assessment Tax Assessment Total Assessment is a certain percentage of the fair market value that is determined by local assessors to be the total taxable value of land and additions on the property. | Land | Improvement |
|---|---|---|---|---|
| 2025 | $3,149 | $281,831 | $29,563 | $252,268 |
| 2024 | $2,765 | $275,990 | -- | -- |
| 2023 | $2,765 | $250,900 | $29,560 | $307,140 |
| 2022 | $4,025 | $228,090 | $29,560 | $243,440 |
| 2021 | $3,854 | $207,350 | $29,560 | $177,790 |
| 2020 | $4,194 | $207,240 | $29,560 | $182,960 |
| 2019 | $3,794 | $188,400 | $29,560 | $158,840 |
| 2018 | $3,332 | $183,330 | $24,490 | $158,840 |
| 2017 | $3,956 | $186,580 | $24,490 | $162,090 |
| 2016 | $3,956 | $186,580 | $24,490 | $162,090 |
| 2015 | $3,330 | $181,760 | $24,490 | $170,620 |
| 2014 | $3,330 | $165,240 | $24,490 | $140,750 |
Source: Public Records
Map
Nearby Homes
- 31011 E Lost Creek Blvd
- 31015 E Lost Creek Blvd
- 38214 E Sulphur Creek Dr
- 30607 N Sulphur Creek Dr
- 30515 Red Bluff Cir
- 30731 N Cripple Creek Dr
- 28812 Village Bend
- 30814 N Cripple Creek Dr
- 38910 Fm 1774 Rd
- 100 Sterling River Ln
- TBD N Cripple Creek Dr
- 30714 Meadow Wood Lot 64 Dr
- 28822 Village Bend
- 135 Sterling River Ln
- 163 Sterling River Ln
- 177 Sterling River Ln
- 186 Sterling River Ln
- 190 Sterling River Ln
- 194 Sterling River Ln
- Springsteen Plan at Magnolia Ridge - Watermill Collection
- 30914 W Lost Creek Blvd
- 30910 W Lost Creek Blvd
- 30926 W Lost Creek Blvd
- 30906 W Lost Creek Blvd
- 30930 W Lost Creek Blvd
- 30915 W Lost Creek Blvd
- 30919 W Lost Creek Blvd
- 30911 W Lost Creek Blvd
- 30923 W Lost Creek Blvd
- 30902 W Lost Creek Blvd
- 30934 W Lost Creek Blvd
- 30907 W Lost Creek Blvd
- 30903 W Lost Creek Blvd
- 38302 Lake Tahoe Ln
- 30834 W Lost Creek Blvd
- 30938 W Lost Creek Blvd
- 30835 W Lost Creek Blvd
- 30906 Roadie Pass
- 30910 Roadie Pass
- 30914 Roadie Pass