3092 23rd St S Fargo, ND 58103
Brunsdale NeighborhoodEstimated Value: $159,000 - $172,000
About This Home
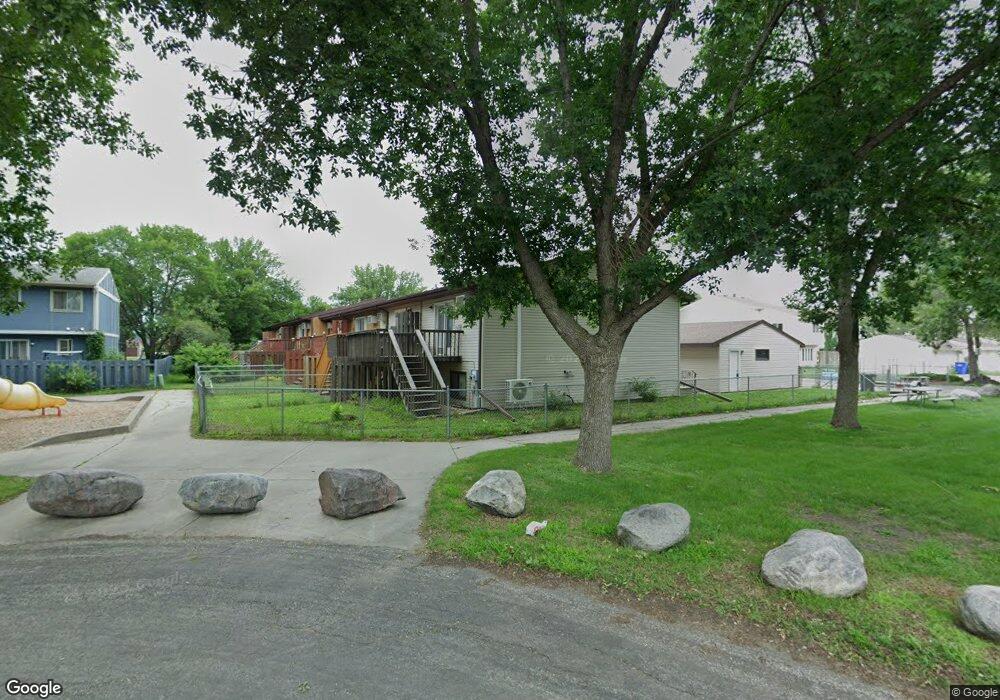
This home is located at 3092 23rd St S, Fargo, ND 58103 and is currently estimated at $166,678, approximately $144 per square foot. 3092 23rd St S is a home located in Cass County with nearby schools including Ed Clapp Elementary School, Carl Ben Eielson Middle School, and South High School.
Ownership History
We collect this data history from publicly available records. To have your information removed, we recommend requesting removal directly through your county’s website.
Purchase Details
Home Financials for this Owner
Home Financials are based on the most recent Mortgage that was taken out on this home.Purchase Details
Home Financials for this Owner
Home Financials are based on the most recent Mortgage that was taken out on this home.Purchase Details
Home Financials for this Owner
Home Financials are based on the most recent Mortgage that was taken out on this home.Home Values in the Area
Average Home Value in this Area
Purchase History
We collect this data history from publicly available records. To have your information removed, we recommend requesting removal directly through your county’s website.
| Date | Buyer | Sale Price | Title Company |
|---|---|---|---|
| $134,500 | Title Co | ||
| -- | -- | ||
| -- | -- |
Mortgage History
We collect this data history from publicly available records. To have your information removed, we recommend requesting removal directly through your county’s website.
| Date | Status | Borrower | Loan Amount |
|---|---|---|---|
| Open | $132,063 | ||
| Previous Owner | $93,150 | ||
| Previous Owner | $17,700 |
Tax History
We collect this data history from publicly available records. To have your information removed, we recommend requesting removal directly through your county’s website.
| Year | Tax Paid | Tax Assessment Tax Assessment Total Assessment is a certain percentage of the fair market value that is determined by local assessors to be the total taxable value of land and additions on the property. | Land | Improvement |
|---|---|---|---|---|
| 2025 | $696 | $82,600 | $10,400 | $72,200 |
| 2024 | $1,708 | $79,400 | $10,400 | $69,000 |
| 2023 | $2,040 | $75,600 | $10,400 | $65,200 |
| 2022 | $1,940 | $70,650 | $10,400 | $60,250 |
| 2021 | $1,584 | $58,600 | $7,500 | $51,100 |
| 2020 | $1,533 | $57,450 | $7,500 | $49,950 |
| 2019 | $1,462 | $54,700 | $4,450 | $50,250 |
| 2018 | $1,443 | $54,700 | $4,450 | $50,250 |
| 2017 | $1,339 | $52,100 | $4,450 | $47,650 |
| 2016 | $1,193 | $50,600 | $4,450 | $46,150 |
| 2015 | $1,327 | $52,250 | $3,050 | $49,200 |
| 2014 | $1,182 | $45,850 | $3,050 | $42,800 |
| 2013 | $1,183 | $45,850 | $3,050 | $42,800 |
Map
- 2260 30 1 2 Ave S
- 2330 30th Ave S
- 2332 30th Ave S
- 2336 30th Ave S
- 2338 30th Ave S
- 2116 28th Ave S
- 2108 28th Ave S
- 1907 29th Ave S
- 2914 S Bay Dr S Unit S
- 3025 18th St S
- 1808 28th Ave S
- 1919 27th Ave S
- 1907 27th Ave S
- 2408 34th Ave S
- 2709 30th Ave S
- 2721 30th Ave S
- 1731 27th Ave S
- 2728 33 1 2 Ave S
- 1631 31st Ave S
- 2826 28th Ave S
- 2256 30 1/2 Ave S
- 2256 30 1 2 Ave S
- 2264 30 1 2 Ave S
- 2268 30 1 2 Ave S
- 2272 30 1 2 Ave S
- 2252-30 1 2 30 1 2 Ave S
- 2260 30 1/2 Ave S
- 2264 30 1/2 Ave S
- 2252 30 1/2 Ave S
- 2272 30 1/2 Ave S
- 2268 30 1/2 Ave S
- 2252 30 1 2 Ave S
- 3058 23rd St S
- 3056 23rd St S
- 2276 30 1 2 Ave S
- 2232 30 1/2 Ave S
- 3052 23rd St S
- 2232 30 1 2 Ave S
- 2236 30 1 2 Ave S
- 2276 30 1/2 Ave S
Ask me questions while you tour the home.