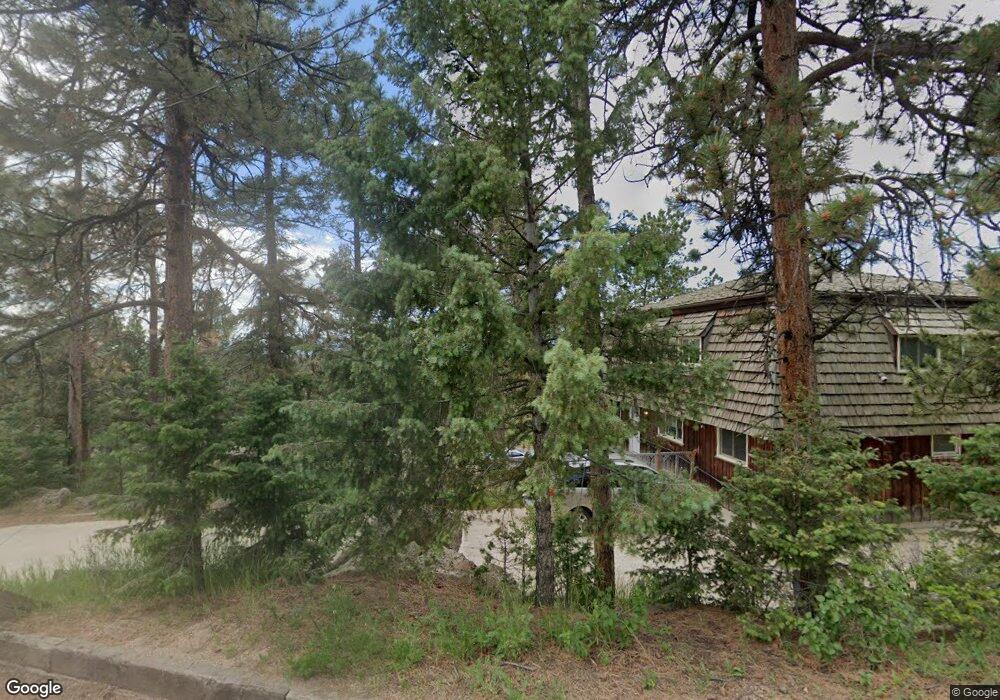
30938 Witteman Rd Conifer, CO 80433
Kings Valley NeighborhoodEstimated Value: $971,660 - $1,000,000
2
Beds
5
Baths
2,856
Sq Ft
$344/Sq Ft
Est. Value
About This Home
This home is located at 30938 Witteman Rd, Conifer, CO 80433 and is currently estimated at $983,165, approximately $344 per square foot. 30938 Witteman Rd is a home located in Jefferson County with nearby schools including Elk Creek Elementary School, West Jefferson Middle School, and Conifer Senior High School.
Ownership History
Date
Name
Owned For
Owner Type
Purchase Details
Closed on
Apr 8, 2002
Sold by
Popp David E
Bought by
Vollmuth Jack R and Vollmuth Jolene M
Current Estimated Value
Home Financials for this Owner
Home Financials are based on the most recent Mortgage that was taken out on this home.
Original Mortgage
$389,500
Outstanding Balance
$161,350
Interest Rate
6.8%
Mortgage Type
Stand Alone First
Estimated Equity
$821,815
Purchase Details
Closed on
Jun 21, 1999
Sold by
Popp David E and Popp Kimberley C
Bought by
Popp David E
Home Financials for this Owner
Home Financials are based on the most recent Mortgage that was taken out on this home.
Original Mortgage
$270,000
Interest Rate
7.68%
Purchase Details
Closed on
Jul 8, 1997
Sold by
Chipman Richard K and Chipman Kathleen J
Bought by
Popp David E and Popp Kimberley C
Home Financials for this Owner
Home Financials are based on the most recent Mortgage that was taken out on this home.
Original Mortgage
$236,000
Interest Rate
7.94%
Create a Home Valuation Report for This Property
The Home Valuation Report is an in-depth analysis detailing your home's value as well as a comparison with similar homes in the area
Home Values in the Area
Average Home Value in this Area
Purchase History
| Date | Buyer | Sale Price | Title Company |
|---|---|---|---|
| Vollmuth Jack R | $389,500 | Chicago Title Co | |
| Popp David E | -- | -- | |
| Popp David E | $295,000 | -- |
Source: Public Records
Mortgage History
| Date | Status | Borrower | Loan Amount |
|---|---|---|---|
| Open | Vollmuth Jack R | $389,500 | |
| Previous Owner | Popp David E | $270,000 | |
| Previous Owner | Popp David E | $236,000 |
Source: Public Records
Tax History Compared to Growth
Tax History
| Year | Tax Paid | Tax Assessment Tax Assessment Total Assessment is a certain percentage of the fair market value that is determined by local assessors to be the total taxable value of land and additions on the property. | Land | Improvement |
|---|---|---|---|---|
| 2024 | $5,215 | $61,251 | $8,086 | $53,165 |
| 2023 | $5,215 | $61,251 | $8,086 | $53,165 |
| 2022 | $4,765 | $52,001 | $5,660 | $46,341 |
| 2021 | $5,630 | $53,498 | $5,823 | $47,675 |
| 2020 | $4,726 | $44,134 | $2,585 | $41,549 |
| 2019 | $4,666 | $44,134 | $2,585 | $41,549 |
| 2018 | $4,185 | $39,668 | $7,333 | $32,335 |
| 2017 | $3,836 | $39,668 | $7,333 | $32,335 |
| 2016 | $4,191 | $40,746 | $8,293 | $32,453 |
| 2015 | $4,281 | $40,746 | $8,293 | $32,453 |
| 2014 | $4,281 | $38,609 | $9,284 | $29,325 |
Source: Public Records
Map
Nearby Homes
- 12282 Hosman Ct
- 30599 Rand Rd
- 12595 US Highway 285
- 30589 Hood Rd
- 12115 Bear Park Rd
- 30703 Kings Valley Dr
- 30824 Kings Valley Dr
- 30402 Kings Valley
- 30382 Kings Valley E
- 30862 Pike View Dr
- 000 Pike View Dr
- 31545 Pike View Dr
- 31327 Kings Valley W
- 11723 Braun Way
- 11698 Nichols Way
- 11618 Nichols Way Unit 23
- 11637 Leavenworth Dr
- 11526 Green Cir
- 12322 S Wamblee Valley Rd
- 12650 Elk Haven Ln
- 30968 Witteman Rd
- 30918 Witteman Rd
- 12296 Styve Rd
- 30474 Kings Valley Dr
- 30898 Witteman Rd
- 12577 Us Highway 285
- 30978 Witteman Rd
- 30947 Witteman Rd
- 30907 Witteman Rd
- 30478 Kings Valley Dr
- 12305 Bear Haven Rd
- 30878 Witteman Rd
- 12557 Us Highway 285
- 12222 Hosman Ct
- 30897 Witteman Rd
- 30473 Kings Valley Dr
- 30463 Kings Valley Dr
- 30444 Kings Valley Dr
- 12276 Styve Rd
- 30493 Kings Valley Dr