Estimated Value: $502,000 - $582,000
4
Beds
4
Baths
4,354
Sq Ft
$124/Sq Ft
Est. Value
About This Home
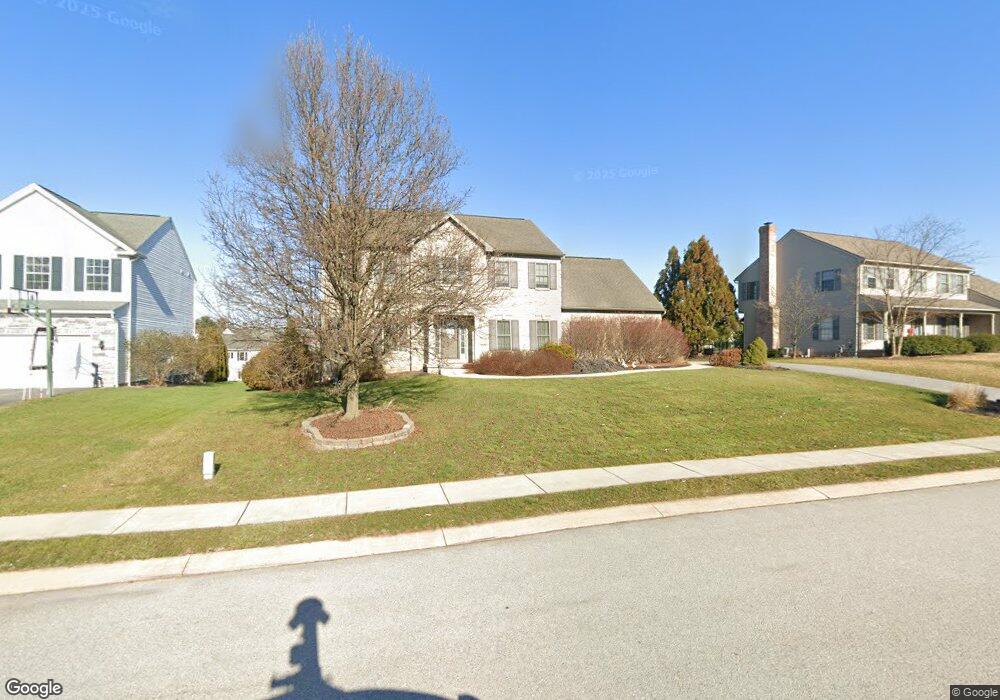
This home is located at 3095 Goldens Path, York, PA 17408 and is currently estimated at $538,156, approximately $123 per square foot. 3095 Goldens Path is a home located in York County with nearby schools including West York Area High School, York Adventist Christian School, and Christian School of York.
Ownership History
Date
Name
Owned For
Owner Type
Purchase Details
Closed on
Dec 9, 2011
Sold by
Kalin Michael and Kalin Amy
Bought by
Yurkow David and Yurkow Kathleen
Current Estimated Value
Purchase Details
Closed on
Jun 13, 2007
Sold by
Walters Marc R and Walters Danielle J
Bought by
Kalin Michael and Kalin Amy
Home Financials for this Owner
Home Financials are based on the most recent Mortgage that was taken out on this home.
Original Mortgage
$299,900
Interest Rate
6.19%
Mortgage Type
Purchase Money Mortgage
Purchase Details
Closed on
Sep 21, 2004
Sold by
Kinsley Robert A and Kinsley Anne W
Bought by
Walters Marc R and Walters Danielle J
Home Financials for this Owner
Home Financials are based on the most recent Mortgage that was taken out on this home.
Original Mortgage
$300,000
Interest Rate
5.69%
Mortgage Type
Fannie Mae Freddie Mac
Create a Home Valuation Report for This Property
The Home Valuation Report is an in-depth analysis detailing your home's value as well as a comparison with similar homes in the area
Home Values in the Area
Average Home Value in this Area
Purchase History
| Date | Buyer | Sale Price | Title Company |
|---|---|---|---|
| Yurkow David | $300,000 | None Available | |
| Kalin Michael | $328,000 | None Available | |
| Walters Marc R | $300,000 | -- |
Source: Public Records
Mortgage History
| Date | Status | Borrower | Loan Amount |
|---|---|---|---|
| Previous Owner | Kalin Michael | $299,900 | |
| Previous Owner | Walters Marc R | $300,000 |
Source: Public Records
Tax History Compared to Growth
Tax History
| Year | Tax Paid | Tax Assessment Tax Assessment Total Assessment is a certain percentage of the fair market value that is determined by local assessors to be the total taxable value of land and additions on the property. | Land | Improvement |
|---|---|---|---|---|
| 2025 | $9,462 | $280,590 | $44,910 | $235,680 |
| 2024 | $9,224 | $280,590 | $44,910 | $235,680 |
| 2023 | $9,224 | $280,590 | $44,910 | $235,680 |
| 2022 | $9,224 | $280,590 | $44,910 | $235,680 |
| 2021 | $8,943 | $280,590 | $44,910 | $235,680 |
| 2020 | $8,943 | $280,590 | $44,910 | $235,680 |
| 2019 | $8,775 | $280,590 | $44,910 | $235,680 |
| 2018 | $8,705 | $280,590 | $44,910 | $235,680 |
| 2017 | $8,438 | $280,590 | $44,910 | $235,680 |
| 2016 | $0 | $280,590 | $44,910 | $235,680 |
| 2015 | -- | $280,590 | $44,910 | $235,680 |
| 2014 | -- | $280,590 | $44,910 | $235,680 |
Source: Public Records
Map
Nearby Homes
- 2208 Golden Eagle Dr Unit 111
- 2450 Walnut Bottom Rd Unit 85
- 2934 Ridings Way
- 2762 Sunset Ln
- 2860 Golden Villas Dr
- 2506 Westminster Dr
- 2825 Sparrow Dr
- 2785 Sparrow Dr
- 2755 Anita Dr
- 3254 E Pheasant Cir
- 3606 Kortni Dr
- 3655 Kortni Dr
- 3623 Kortni Dr
- 3653 Kortni Dr
- 3625 Kortni Dr
- 3639 Kortni Dr
- 3637 Kortni Dr
- 3044 Spectrum Rd
- 2700 Thornbridge Rd E
- 2648 Danielle Dr
- 3085 Goldens Path
- 4005 Goldens Path Unit 55
- 4005 Goldens Path
- TBD 1 Goldens Path
- TBD 0 Goldens Path
- to be buil Goldens Path
- 3090 Goldens Path
- 3090 Goldens Path Unit 9
- 4000 Goldens Path
- 4000 Goldens Path Unit Jolie Model, Lot 10
- 3180 Ridings Way
- 4065 Goldens Path
- 3080 Goldens Path Unit 8
- 3080 Goldens Path
- 4035 Goldens Path Unit 54
- 4035 Goldens Path
- 4075 Goldens Path
- 3170 Ridings Way
- 3075 Goldens Path
- 3075 Goldens Path Unit 58