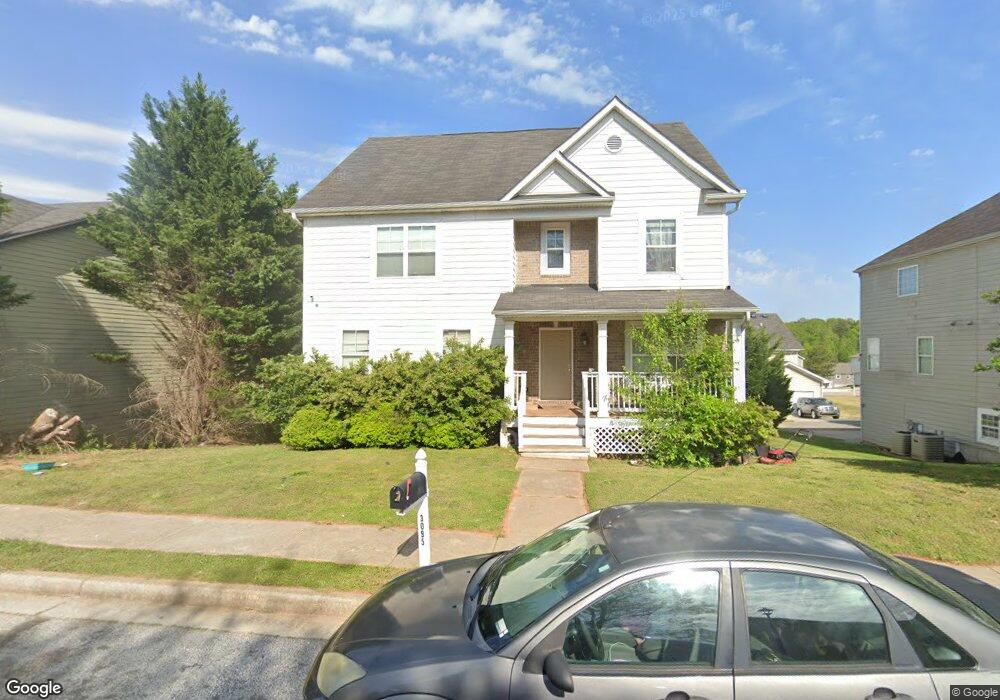
3095 Raven Trace Fairburn, GA 30213
Estimated Value: $285,000 - $332,000
5
Beds
3
Baths
2,838
Sq Ft
$110/Sq Ft
Est. Value
About This Home
This home is located at 3095 Raven Trace, Fairburn, GA 30213 and is currently estimated at $311,275, approximately $109 per square foot. 3095 Raven Trace is a home located in Fulton County with nearby schools including Campbell Elementary School, Renaissance Middle School, and Creekside High School.
Ownership History
Date
Name
Owned For
Owner Type
Purchase Details
Closed on
Jul 13, 2018
Sold by
Boone Mark J
Bought by
Boone Properties Llc
Current Estimated Value
Purchase Details
Closed on
Dec 15, 2015
Sold by
Boone Mark J
Bought by
Boone Properties Llc
Purchase Details
Closed on
Aug 26, 2010
Sold by
Boone Mark J
Bought by
Boone Properties Llc
Home Financials for this Owner
Home Financials are based on the most recent Mortgage that was taken out on this home.
Original Mortgage
$96,000
Interest Rate
4.6%
Mortgage Type
Stand Alone Second
Purchase Details
Closed on
Jul 21, 2008
Sold by
Bank Of North Georgia
Bought by
Boone Mark J
Home Financials for this Owner
Home Financials are based on the most recent Mortgage that was taken out on this home.
Original Mortgage
$96,000
Interest Rate
6.27%
Mortgage Type
New Conventional
Purchase Details
Closed on
Jul 3, 2007
Sold by
Forrest Homes Inc
Bought by
Bank Of North Georgia
Create a Home Valuation Report for This Property
The Home Valuation Report is an in-depth analysis detailing your home's value as well as a comparison with similar homes in the area
Home Values in the Area
Average Home Value in this Area
Purchase History
| Date | Buyer | Sale Price | Title Company |
|---|---|---|---|
| Boone Properties Llc | -- | -- | |
| Boone Properties Llc | -- | -- | |
| Boone Mark J | -- | -- | |
| Boone Properties Llc | -- | -- | |
| Boone Mark J | $120,000 | -- | |
| Bank Of North Georgia | $180,000 | -- |
Source: Public Records
Mortgage History
| Date | Status | Borrower | Loan Amount |
|---|---|---|---|
| Previous Owner | Boone Properties Llc | $96,000 | |
| Previous Owner | Boone Mark J | $96,000 |
Source: Public Records
Tax History Compared to Growth
Tax History
| Year | Tax Paid | Tax Assessment Tax Assessment Total Assessment is a certain percentage of the fair market value that is determined by local assessors to be the total taxable value of land and additions on the property. | Land | Improvement |
|---|---|---|---|---|
| 2025 | $1,102 | $141,840 | $22,280 | $119,560 |
| 2023 | $3,255 | $115,320 | $14,200 | $101,120 |
| 2022 | $3,034 | $115,320 | $14,200 | $101,120 |
| 2021 | $1,682 | $62,000 | $8,560 | $53,440 |
| 2020 | $1,723 | $62,000 | $8,560 | $53,440 |
| 2019 | $702 | $62,000 | $8,560 | $53,440 |
| 2018 | $2,023 | $71,680 | $8,560 | $63,120 |
| 2017 | $1,123 | $38,480 | $5,280 | $33,200 |
| 2016 | $1,123 | $38,480 | $5,280 | $33,200 |
| 2015 | $1,128 | $38,480 | $5,280 | $33,200 |
| 2014 | $992 | $32,360 | $4,760 | $27,600 |
Source: Public Records
Map
Nearby Homes
- 4095 Oriole Ln
- 1995 Liberty Heights
- 25 Vickers Rd
- Layla II Plan at Enclave at Evergreen
- Reagan Plan at Enclave at Evergreen
- Emma Plan at Enclave at Evergreen
- Zoey II Plan at Enclave at Evergreen
- Millhaven Plan at Enclave at Evergreen
- 80 Hydrangea Cir
- 82 Hydrangea Cir
- 6010 Capitol Knoll
- 49 Fireside Way
- 7820 Marie Way
- 13 Camellia Dr
- 11 Camellia Dr
- 9 Camellia Dr
- 7 Camellia Dr
- 15 Camellia Dr
- 3105 Raven Trace
- 3085 Raven Trace
- 4090 Oriole Ln
- 4100 Oriole Ln
- 4080 Oriole Ln
- 3075 Raven Trace
- 3090 Raven Trace
- 3115 Raven Trace
- 3100 Raven Trace
- 3100 Raven Trace Unit Tr
- 4070 Oriole Ln
- 3080 Raven Trace
- 4110 Oriole Ln
- 3065 Raven Trace
- 3070 Raven Trace
- 4060 Oriole Ln
- 2075 Liberty Heights
- 2065 Liberty Heights
- 4105 Oriole Ln
- 4115 Oriole Ln