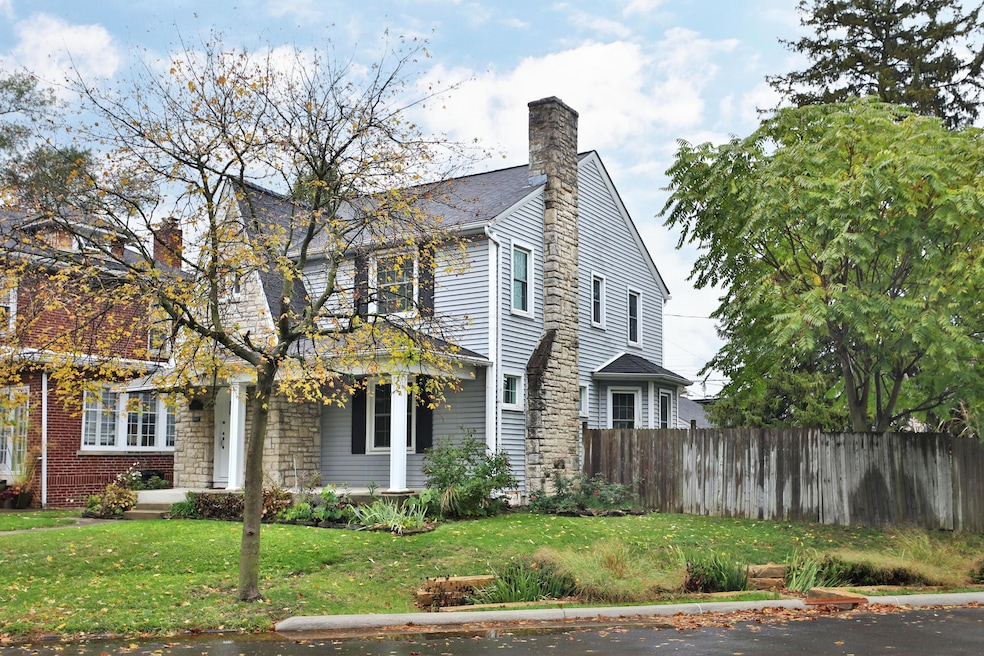
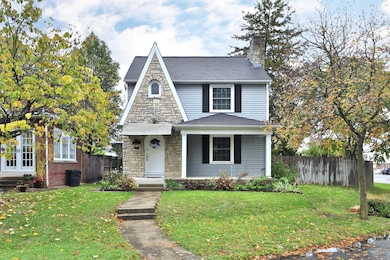
3096 Ellis Place Columbus, OH 43204
Westgate NeighborhoodEstimated payment $2,024/month
Highlights
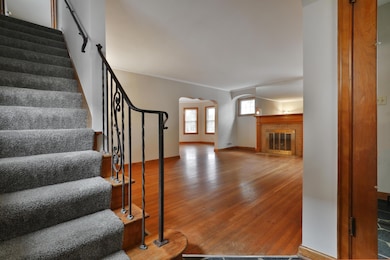
- Craftsman Architecture
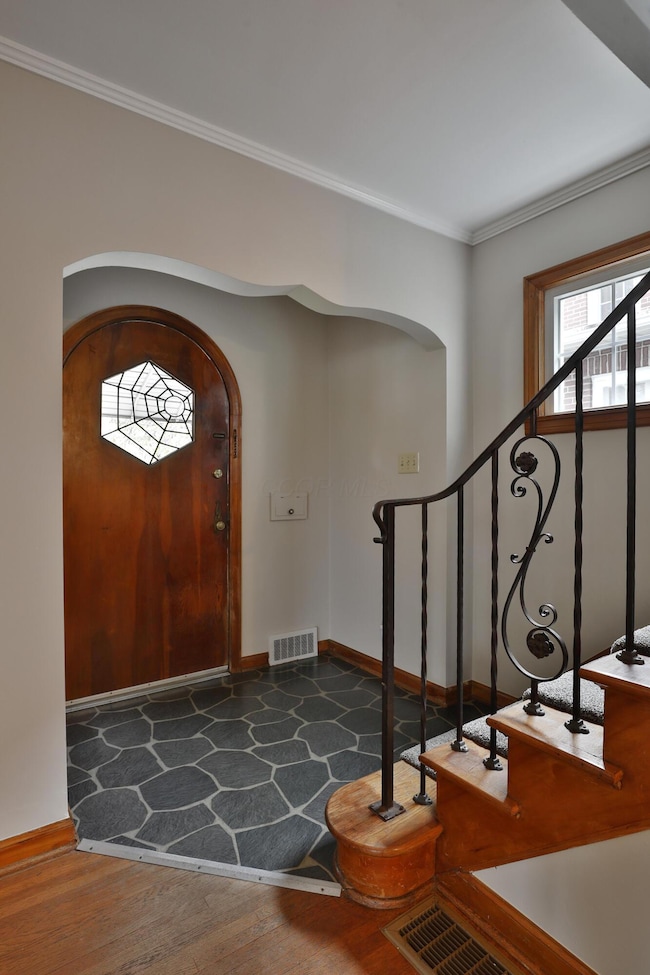
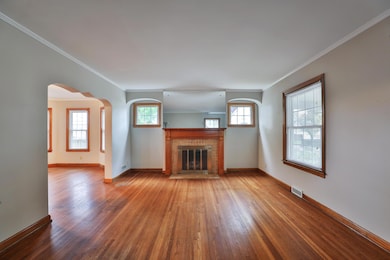
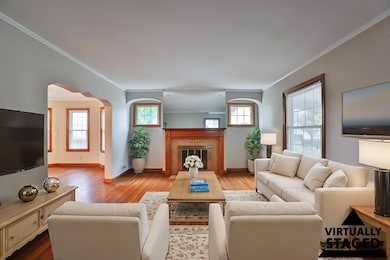
- Wood Flooring
- Fenced Yard
- Deck
- No HOA
- 2 Car Detached Garage
About This Home
Extensive renovations make this charming Westgate three-bedroom, two-story home an easy ''yes.'' Gleaming hardwood floors and natural woodwork highlight the living and dining rooms, while the highly updated kitchen—with all appliances and a breakfast bar—delivers the function and style buyers want today. A brand-new furnace (November 2025) plus numerous recent updates add real peace of mind. Check the Documents file for the full list of improvements. This home brings the classic Westgate charm you've been hunting for at a price that you can afford. You'll be glad you waited for this one. Choice home warranty in place.
Listing Agent
Keller Williams Capital Ptnrs License #2014000204 Listed on: 11/24/2025

Home Details
Home Type
- Single Family
Est. Annual Taxes
- $3,684
Year Built
- Built in 1939
Lot Details
- 6,098 Sq Ft Lot
- Fenced Yard
Parking
- 2 Car Detached Garage
- Garage Door Opener
- Off-Street Parking: 1
Home Design
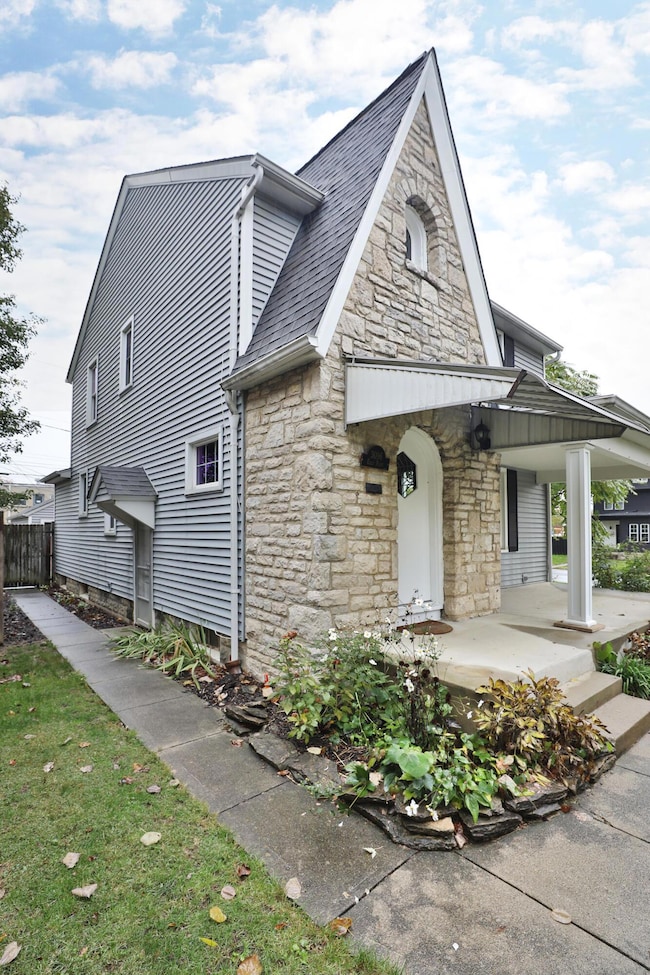
- Craftsman Architecture
- Block Foundation
- Vinyl Siding
- Stone Exterior Construction
Interior Spaces
- 1,544 Sq Ft Home
- 2-Story Property
- Gas Log Fireplace
- Insulated Windows
- Basement Fills Entire Space Under The House
Kitchen
- Gas Range
- Microwave
- Dishwasher
Flooring
- Wood
- Carpet
- Ceramic Tile
- Vinyl
Bedrooms and Bathrooms
- 3 Bedrooms
- 1 Full Bathroom
Outdoor Features
- Deck
- Patio
Utilities
- Forced Air Heating and Cooling System
- Heating System Uses Gas
Community Details
- No Home Owners Association
Listing and Financial Details
- Assessor Parcel Number 010-025611
Map
Home Values in the Area
Average Home Value in this Area
Tax History
| Year | Tax Paid | Tax Assessment Tax Assessment Total Assessment is a certain percentage of the fair market value that is determined by local assessors to be the total taxable value of land and additions on the property. | Land | Improvement |
|---|---|---|---|---|
| 2024 | $3,684 | $82,080 | $22,050 | $60,030 |
| 2023 | $3,637 | $82,075 | $22,050 | $60,025 |
| 2022 | $2,984 | $57,540 | $8,400 | $49,140 |
| 2021 | $2,990 | $57,540 | $8,400 | $49,140 |
| 2020 | $2,993 | $57,540 | $8,400 | $49,140 |
| 2019 | $2,943 | $48,510 | $7,000 | $41,510 |
| 2018 | $2,676 | $48,510 | $7,000 | $41,510 |
| 2017 | $2,800 | $48,510 | $7,000 | $41,510 |
| 2016 | $2,660 | $40,150 | $11,310 | $28,840 |
| 2015 | $2,414 | $40,150 | $11,310 | $28,840 |
| 2014 | $2,420 | $40,150 | $11,310 | $28,840 |
| 2013 | $1,194 | $40,145 | $11,305 | $28,840 |
Property History
| Date | Event | Price | List to Sale | Price per Sq Ft |
|---|---|---|---|---|
| 11/24/2025 11/24/25 | For Sale | $325,000 | -- | $210 / Sq Ft |
Purchase History
| Date | Type | Sale Price | Title Company |
|---|---|---|---|
| Interfamily Deed Transfer | -- | Stella Title Agency Inc | |
| Interfamily Deed Transfer | -- | Multiple | |
| Warranty Deed | $84,000 | Celtic Title Agency Inc |
Mortgage History
| Date | Status | Loan Amount | Loan Type |
|---|---|---|---|
| Open | $41,780 | Adjustable Rate Mortgage/ARM | |
| Closed | $76,000 | Purchase Money Mortgage | |
| Closed | $79,800 | No Value Available |
Source: Columbus and Central Ohio Regional MLS
MLS Number: 225044011
APN: 010-025611
Disclaimer: Certain information contained herein is derived from information provided by parties other than Homes.com. All information provided is deemed reliable, but is not guaranteed to be accurate and should be independently verified.
![]() IDX information is provided exclusively for personal, non-commercial use, and may not be used for any purpose other than to identify prospective properties consumers may be interested in purchasing.
IDX information is provided exclusively for personal, non-commercial use, and may not be used for any purpose other than to identify prospective properties consumers may be interested in purchasing.
Information is deemed reliable but not guaranteed.
- 32 Orel Ave
- 66 N Brinker Ave
- 36-38 Orel Ave
- 133 S Brinker Ave
- 75 N Huron Ave
- 58 Binns Blvd
- 99 N Brinker Ave Unit 101
- 119 N Westgate Ave
- 113 N Brinker Ave Unit 115
- 3100 Steele Ave
- 154-156 N Huron Ave
- 79 S Southampton Ave
- 160 N Sylvan Ave
- 211 Guernsey Ave
- 195 S Sylvan Ave
- 267 S Westgate Ave
- 65 N Chase Ave
- 43 Letchworth Ave
- 0 S Brinker Ave
- 30 Demorest Rd
- 109 S Westgate Ave
- 3080 Steele Ave
- 3333 W Broad St Unit Apartment 19
- 195 S Sylvan Ave
- 3473 Derrer Hill Dr
- 372-374-374 S Huron Ave Unit 372
- 372-374-374 S Huron Ave Unit 374
- 341 S Roys Ave
- 181 Derrer Rd
- 185 N Harris Ave
- 448 S Huron Ave
- 299 S Warren Ave
- 453 S Powell Ave
- 3295 Sullivant Ave Unit N
- 40 S Richardson Ave
- 2895 Sullivant Ave
- 169 N Wilson Rd
- 300 Overstreet Way
- 478 S Richardson Ave Unit 2
- 587 S Ogden Ave