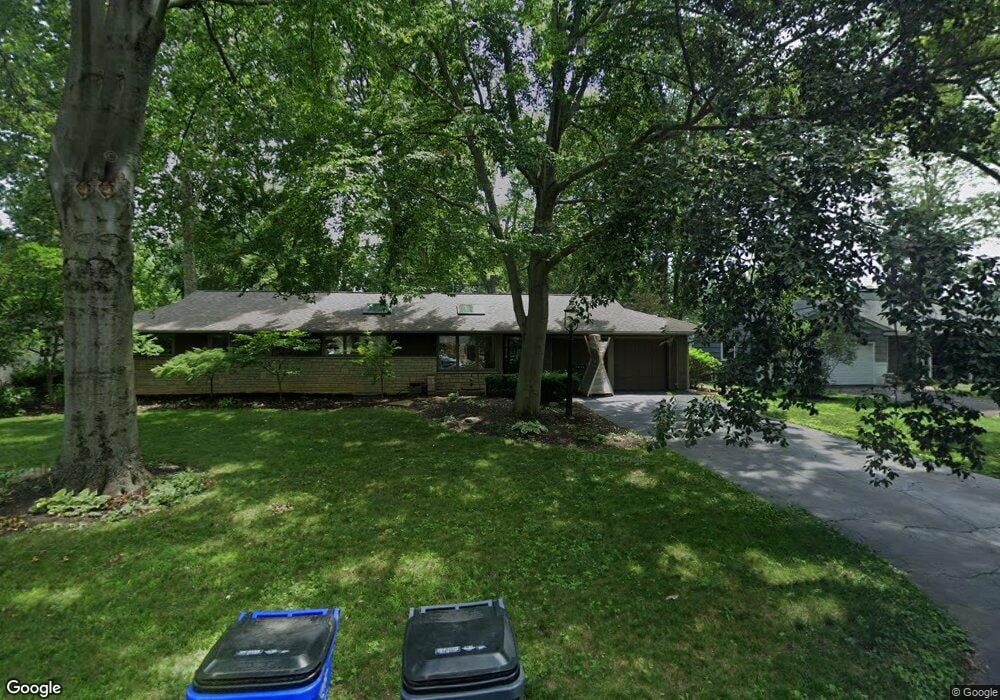
3096 Herrick Rd Columbus, OH 43221
Estimated Value: $556,000 - $709,000
3
Beds
3
Baths
1,718
Sq Ft
$352/Sq Ft
Est. Value
About This Home
This home is located at 3096 Herrick Rd, Columbus, OH 43221 and is currently estimated at $604,776, approximately $352 per square foot. 3096 Herrick Rd is a home located in Franklin County with nearby schools including Tremont Elementary School, Jones Middle School, and Upper Arlington High School.
Ownership History
Date
Name
Owned For
Owner Type
Purchase Details
Closed on
Mar 24, 2023
Sold by
Lyden Vicki E
Bought by
Hughes Larry G and Hughes Mary C
Current Estimated Value
Purchase Details
Closed on
Mar 6, 2023
Sold by
Lyden Vicki E
Bought by
Hughes Larry G and Hughes Mary C
Purchase Details
Closed on
Oct 12, 2005
Sold by
Dixon Daniel J and Dixon Sally A
Bought by
Lyden Vicki E
Home Financials for this Owner
Home Financials are based on the most recent Mortgage that was taken out on this home.
Original Mortgage
$170,001
Interest Rate
5.82%
Mortgage Type
Fannie Mae Freddie Mac
Purchase Details
Closed on
May 25, 1999
Sold by
Maglione Timothy I
Bought by
Dixon Daniel J and Dixon Sally A
Home Financials for this Owner
Home Financials are based on the most recent Mortgage that was taken out on this home.
Original Mortgage
$165,000
Interest Rate
6.94%
Purchase Details
Closed on
Oct 20, 1993
Bought by
Maglione Timothy I
Purchase Details
Closed on
Mar 12, 1992
Purchase Details
Closed on
Oct 2, 1989
Create a Home Valuation Report for This Property
The Home Valuation Report is an in-depth analysis detailing your home's value as well as a comparison with similar homes in the area
Home Values in the Area
Average Home Value in this Area
Purchase History
| Date | Buyer | Sale Price | Title Company |
|---|---|---|---|
| Hughes Larry G | $499,000 | Stewart Title | |
| Hughes Larry G | $499,000 | Stewart Title | |
| Lyden Vicki E | $310,000 | -- | |
| Dixon Daniel J | $217,500 | Chicago Title | |
| Maglione Timothy I | -- | -- | |
| -- | $126,500 | -- | |
| -- | -- | -- |
Source: Public Records
Mortgage History
| Date | Status | Borrower | Loan Amount |
|---|---|---|---|
| Previous Owner | Lyden Vicki E | $170,001 | |
| Previous Owner | Dixon Daniel J | $165,000 |
Source: Public Records
Tax History Compared to Growth
Tax History
| Year | Tax Paid | Tax Assessment Tax Assessment Total Assessment is a certain percentage of the fair market value that is determined by local assessors to be the total taxable value of land and additions on the property. | Land | Improvement |
|---|---|---|---|---|
| 2024 | $8,657 | $149,530 | $62,270 | $87,260 |
| 2023 | $8,549 | $149,530 | $62,270 | $87,260 |
| 2022 | $8,113 | $116,100 | $54,080 | $62,020 |
| 2021 | $7,182 | $116,100 | $54,080 | $62,020 |
| 2020 | $7,118 | $116,100 | $54,080 | $62,020 |
| 2019 | $7,034 | $101,440 | $54,080 | $47,360 |
| 2018 | $6,295 | $101,440 | $54,080 | $47,360 |
| 2017 | $6,291 | $101,440 | $54,080 | $47,360 |
| 2016 | $5,601 | $84,710 | $48,480 | $36,230 |
| 2015 | $5,596 | $84,710 | $48,480 | $36,230 |
| 2014 | $5,602 | $84,710 | $48,480 | $36,230 |
| 2013 | $2,675 | $77,000 | $44,065 | $32,935 |
Source: Public Records
Map
Nearby Homes
- 3163 S Dorchester Rd
- 2544 Zollinger Rd
- 2370 Zollinger Rd
- 3041 Avalon Rd
- 3190 Kioka Ave
- 2979 Avalon Rd
- 2731 Clifton Rd
- 2527 Wickliffe Rd
- 2785 Chateau Cir Unit 69
- 2227 Zollinger Rd
- 2782 Chateau Cir S Unit 45
- 2424 Nottingham Rd
- 2565 Nottingham Rd
- 2401 Shrewsbury Rd
- 2308 Shrewsbury Rd
- 2714 Woodstock Rd
- 2162 Oakmount Rd
- 3441 Sunset Dr
- 2666 Shrewsbury Rd
- 2413 Edgevale Rd
- 3108 Herrick Rd
- 3082 Herrick Rd
- 3087 Leeds Rd
- 3101 Leeds Rd
- 3075 Leeds Rd
- 3097 Herrick Rd
- 3120 Herrick Rd
- 3070 Herrick Rd
- 3083 Herrick Rd
- 3109 Herrick Rd
- 3113 Leeds Rd
- 3063 Leeds Rd
- 3121 Herrick Rd
- 3071 Herrick Rd
- 3056 Herrick Rd
- 3134 Herrick Rd
- 3104 S Dorchester Rd
- 3086 Leeds Rd
- 3090 S Dorchester Rd
- 3127 Leeds Rd