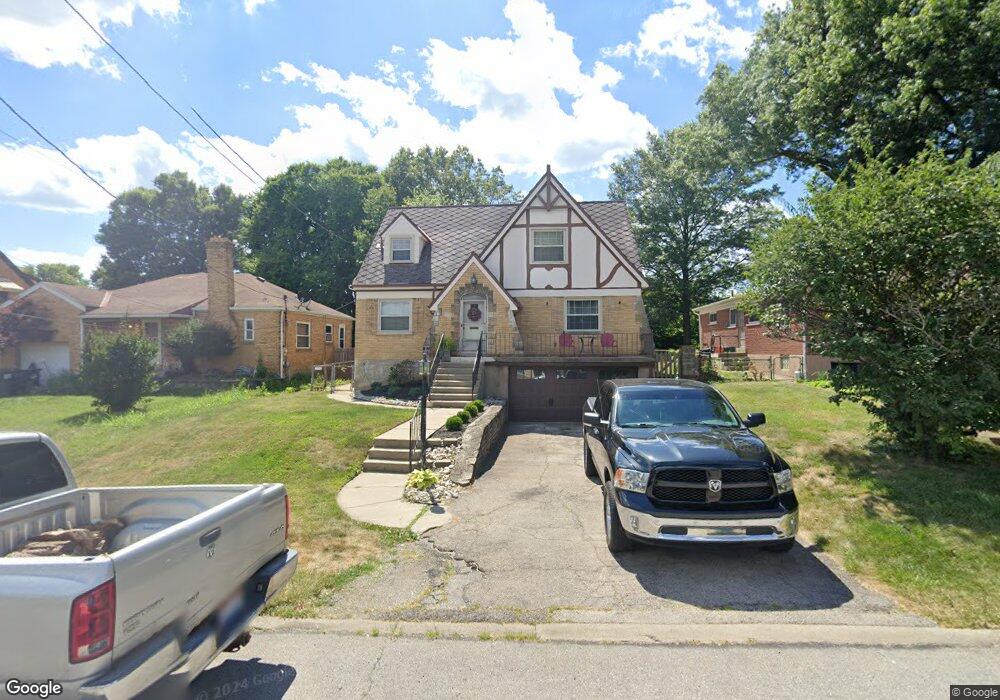
3097 Neisel Ave Cincinnati, OH 45248
Estimated Value: $218,000 - $247,000
2
Beds
2
Baths
1,834
Sq Ft
$124/Sq Ft
Est. Value
About This Home
This home is located at 3097 Neisel Ave, Cincinnati, OH 45248 and is currently estimated at $227,588, approximately $124 per square foot. 3097 Neisel Ave is a home located in Hamilton County with nearby schools including John Foster Dulles Elementary School, Rapid Run Middle School, and Oak Hills High School.
Ownership History
Date
Name
Owned For
Owner Type
Purchase Details
Closed on
Oct 15, 2001
Sold by
Shelton John L and Shelton Pamela S
Bought by
Reddington Douglas A and Reddington Tina M
Current Estimated Value
Home Financials for this Owner
Home Financials are based on the most recent Mortgage that was taken out on this home.
Original Mortgage
$10,000
Interest Rate
6.88%
Purchase Details
Closed on
Jun 7, 2001
Sold by
Roule Gertrude H and Roule Arthur
Bought by
Shelton John L and Shelton Pamela Sue
Home Financials for this Owner
Home Financials are based on the most recent Mortgage that was taken out on this home.
Original Mortgage
$105,000
Interest Rate
7.2%
Purchase Details
Closed on
May 19, 2001
Sold by
Brillinger Siegfried L and Brillinger Joan
Bought by
Shelton John L and Shelton Pamela Sue
Home Financials for this Owner
Home Financials are based on the most recent Mortgage that was taken out on this home.
Original Mortgage
$105,000
Interest Rate
7.2%
Purchase Details
Closed on
Oct 16, 1998
Sold by
Brillinger Rudolf
Bought by
Brillinger Ida J
Create a Home Valuation Report for This Property
The Home Valuation Report is an in-depth analysis detailing your home's value as well as a comparison with similar homes in the area
Home Values in the Area
Average Home Value in this Area
Purchase History
| Date | Buyer | Sale Price | Title Company |
|---|---|---|---|
| Reddington Douglas A | $117,000 | -- | |
| Shelton John L | $22,400 | -- | |
| Shelton John L | $22,400 | Court St Title Agency | |
| Brillinger Ida J | -- | -- |
Source: Public Records
Mortgage History
| Date | Status | Borrower | Loan Amount |
|---|---|---|---|
| Closed | Reddington Douglas A | $10,000 | |
| Closed | Shelton John L | $105,000 |
Source: Public Records
Tax History
| Year | Tax Paid | Tax Assessment Tax Assessment Total Assessment is a certain percentage of the fair market value that is determined by local assessors to be the total taxable value of land and additions on the property. | Land | Improvement |
|---|---|---|---|---|
| 2025 | $2,996 | $57,579 | $11,638 | $45,941 |
| 2023 | $2,924 | $57,579 | $11,638 | $45,941 |
| 2022 | $2,508 | $41,857 | $10,388 | $31,469 |
| 2021 | $2,252 | $41,857 | $10,388 | $31,469 |
| 2020 | $2,281 | $41,857 | $10,388 | $31,469 |
| 2019 | $2,233 | $37,373 | $9,275 | $28,098 |
| 2018 | $2,236 | $37,373 | $9,275 | $28,098 |
| 2017 | $2,108 | $37,373 | $9,275 | $28,098 |
| 2016 | $2,206 | $39,082 | $9,531 | $29,551 |
| 2015 | $2,225 | $39,082 | $9,531 | $29,551 |
| 2014 | $2,228 | $39,082 | $9,531 | $29,551 |
| 2013 | $2,103 | $39,473 | $9,625 | $29,848 |
Source: Public Records
Map
Nearby Homes
- 3531 Werk Rd
- 3088 Belden Cir
- 2985 Welge Ln
- 2710 Carroll Ave
- 5375 Werk Rd
- 3599 Schwartze Ave
- 3238 Buell St
- 3281 Pickbury Dr
- 3230 Stanhope Ave
- 3617 Fieldcrest Dr
- 5448 Robert Ave
- 3157 Westbourne Dr
- 5487 Belcross Ct
- 2299 Townhill Rd
- 3317 Buell St
- 3578 Fieldcrest Dr
- 3244 Glenmore Ave
- 2195 Woodmere Ct
- 3823 Applegate Ave
- 3305 Queen City Ave
- 3095 Neisel Ave
- 3099 Neisel Ave
- 3093 Neisel Ave
- 3088 Crestmoor Ln
- 3091 Neisel Ave
- 3571 Werk Rd
- 3575 Werk Rd
- 3567 Werk Rd
- 3096 Crestmoor Ln
- 3579 Werk Rd
- 3080 Crestmoor Ln
- 3089 Neisel Ave
- 3096 Neisel Ave
- 3583 Werk Rd
- 3094 Neisel Ave
- 3072 Crestmoor Ln
- 3555 Werk Rd
- 3092 Neisel Ave
- 3064 Crestmoor Ln
- 3090 Neisel Ave
Your Personal Tour Guide
Ask me questions while you tour the home.