Estimated Value: $459,000 - $587,019
4
Beds
3
Baths
2,866
Sq Ft
$175/Sq Ft
Est. Value
About This Home
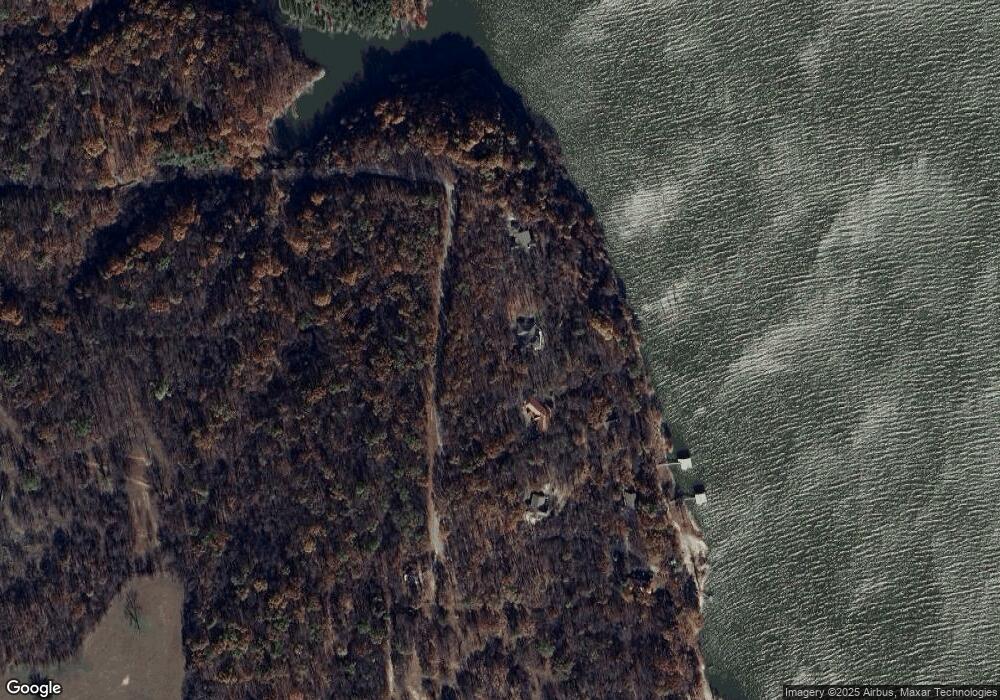
This home is located at 3097 S 4402, Pryor, OK 74361 and is currently estimated at $502,755, approximately $175 per square foot. 3097 S 4402 is a home with nearby schools including Salina Elementary School, Salina Middle School, and Salina High School.
Ownership History
Date
Name
Owned For
Owner Type
Purchase Details
Closed on
Feb 22, 2024
Sold by
Moore Syble Yvonne
Bought by
Syble Yvonne Moore Revocable Trust and Moore
Current Estimated Value
Purchase Details
Closed on
Dec 3, 2010
Sold by
Becker Wolfgang and Becker Silke H
Bought by
Moore Ian R and Moore Syble Y
Home Financials for this Owner
Home Financials are based on the most recent Mortgage that was taken out on this home.
Original Mortgage
$244,000
Interest Rate
4.23%
Mortgage Type
New Conventional
Create a Home Valuation Report for This Property
The Home Valuation Report is an in-depth analysis detailing your home's value as well as a comparison with similar homes in the area
Home Values in the Area
Average Home Value in this Area
Purchase History
| Date | Buyer | Sale Price | Title Company |
|---|---|---|---|
| Syble Yvonne Moore Revocable Trust | -- | None Listed On Document | |
| Moore Ian R | $305,000 | None Available |
Source: Public Records
Mortgage History
| Date | Status | Borrower | Loan Amount |
|---|---|---|---|
| Previous Owner | Moore Ian R | $244,000 |
Source: Public Records
Tax History Compared to Growth
Tax History
| Year | Tax Paid | Tax Assessment Tax Assessment Total Assessment is a certain percentage of the fair market value that is determined by local assessors to be the total taxable value of land and additions on the property. | Land | Improvement |
|---|---|---|---|---|
| 2024 | $5,282 | $45,135 | $16,053 | $29,082 |
| 2023 | $5,282 | $42,986 | $15,786 | $27,200 |
| 2022 | $3,791 | $40,939 | $15,312 | $25,627 |
| 2021 | $3,580 | $38,990 | $14,359 | $24,631 |
| 2020 | $3,463 | $37,133 | $13,437 | $23,696 |
| 2019 | $3,330 | $35,365 | $9,314 | $26,051 |
| 2018 | $3,382 | $35,365 | $9,314 | $26,051 |
| 2017 | $3,352 | $35,365 | $9,314 | $26,051 |
| 2016 | $3,239 | $35,365 | $9,314 | $26,051 |
| 2015 | $3,359 | $35,365 | $9,314 | $26,051 |
| 2014 | $3,359 | $35,365 | $9,314 | $26,051 |
Source: Public Records
Map
Nearby Homes