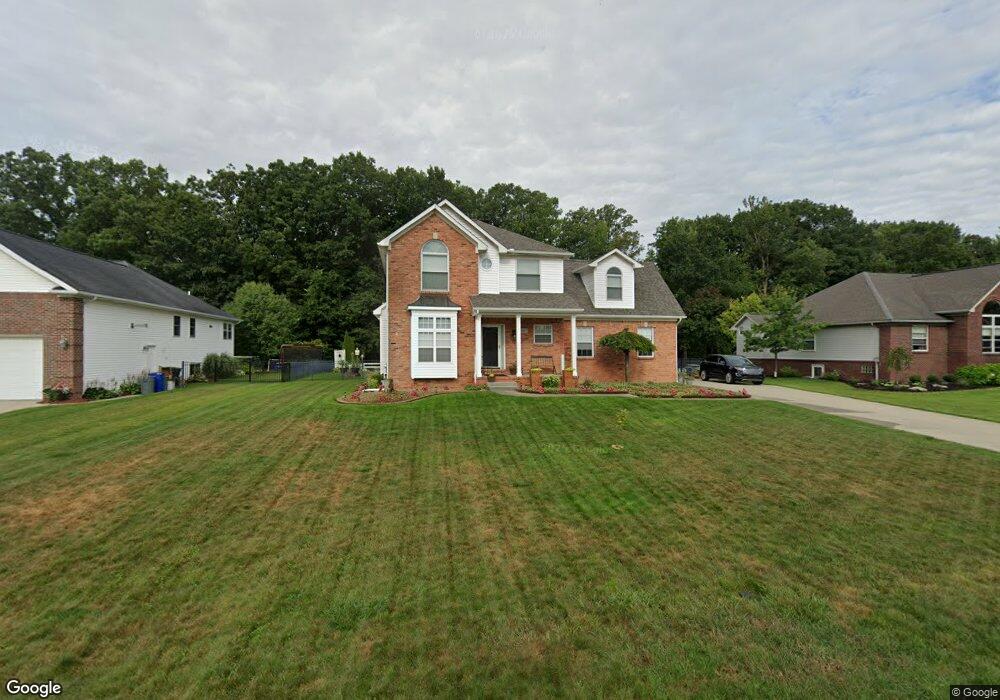
3097 Wexford Cir Port Huron, MI 48060
Estimated Value: $312,000 - $433,000
3
Beds
3
Baths
2,300
Sq Ft
$160/Sq Ft
Est. Value
About This Home
This home is located at 3097 Wexford Cir, Port Huron, MI 48060 and is currently estimated at $368,817, approximately $160 per square foot. 3097 Wexford Cir is a home located in St. Clair County with nearby schools including Michigamme Elementary School, Central Middle School, and Port Huron High School.
Ownership History
Date
Name
Owned For
Owner Type
Purchase Details
Closed on
Mar 12, 2015
Sold by
Fowler Jane Elizabeth and Korth Jane Elizabeth
Bought by
Fowler Jane E and Jane E Fowler Living Trust
Current Estimated Value
Purchase Details
Closed on
Dec 12, 2014
Sold by
Fowler Jane Elizabeth and Korth Jane Elizabeth
Bought by
Fowler Jane Elizabeth
Home Financials for this Owner
Home Financials are based on the most recent Mortgage that was taken out on this home.
Original Mortgage
$104,000
Interest Rate
4.19%
Mortgage Type
New Conventional
Purchase Details
Closed on
Oct 31, 2014
Sold by
Korth Jane E and Korth Patrick
Bought by
Korth Jane E
Home Financials for this Owner
Home Financials are based on the most recent Mortgage that was taken out on this home.
Original Mortgage
$104,000
Interest Rate
4.19%
Mortgage Type
New Conventional
Purchase Details
Closed on
Aug 15, 2013
Sold by
Korth Patrick W and Korth Jane E
Bought by
Korth Jane E and Korth Patrick W
Create a Home Valuation Report for This Property
The Home Valuation Report is an in-depth analysis detailing your home's value as well as a comparison with similar homes in the area
Home Values in the Area
Average Home Value in this Area
Purchase History
| Date | Buyer | Sale Price | Title Company |
|---|---|---|---|
| Fowler Jane E | -- | Attorney | |
| Fowler Jane Elizabeth | -- | None Available | |
| Korth Jane E | -- | Liberty Title | |
| Korth Jane E | -- | None Available |
Source: Public Records
Mortgage History
| Date | Status | Borrower | Loan Amount |
|---|---|---|---|
| Closed | Korth Jane E | $104,000 |
Source: Public Records
Tax History Compared to Growth
Tax History
| Year | Tax Paid | Tax Assessment Tax Assessment Total Assessment is a certain percentage of the fair market value that is determined by local assessors to be the total taxable value of land and additions on the property. | Land | Improvement |
|---|---|---|---|---|
| 2025 | $3,789 | $159,400 | $0 | $0 |
| 2024 | $1,994 | $149,900 | $0 | $0 |
| 2023 | $1,840 | $139,000 | $0 | $0 |
| 2022 | $3,400 | $131,000 | $0 | $0 |
| 2021 | $3,180 | $123,300 | $0 | $0 |
| 2020 | $3,180 | $122,200 | $122,200 | $0 |
| 2019 | $3,124 | $100,800 | $0 | $0 |
| 2018 | $3,055 | $100,800 | $0 | $0 |
| 2017 | $2,991 | $101,300 | $0 | $0 |
| 2016 | $1,510 | $101,300 | $0 | $0 |
| 2015 | -- | $95,300 | $95,300 | $0 |
| 2014 | -- | $87,500 | $87,500 | $0 |
| 2013 | -- | $83,700 | $0 | $0 |
Source: Public Records
Map
Nearby Homes
- 4460 Cambridge Dr
- 4608 Huntington Dr
- 4911 Castlewood Dr
- 3230 Range Rd
- 4361 Peck Rd
- 4570 Atkins Rd
- 4224 Atkins Rd
- 3115 Spruce Dr
- 3152 Spruce Dr
- 0 Lapeer Rd Unit 50137357
- 3559 Lightle Rd
- 3465 West Dr
- 4224 N River Rd
- 4167 N River Rd
- Lot #9 Thornton Dr
- 2863 Beach Rd
- 4380 Lapeer Rd
- 3345 Beach Rd
- 3993 N River Rd
- 3580 Angus Rd
- 3089 Wexford Cir
- 3105 Wexford Cir
- 3079 Wexford Cir
- 3113 Wexford Cir
- 3096 Wexford Cir
- 3071 Wexford Cir
- 3123 Wexford Cir
- 3088 Wexford Cir
- 3104 Wexford Cir
- 3104 Maumee Trail
- 3078 Wexford Cir
- 3112 Wexford Cir
- 3114 Maumee Trail
- 3094 Maumee Trail
- 3124 Maumee Trail
- 3131 Wexford Cir
- VL Wexford Cir
- V/L Wexford Cir
- TBD Wexford
- 3059 Wexford Cir