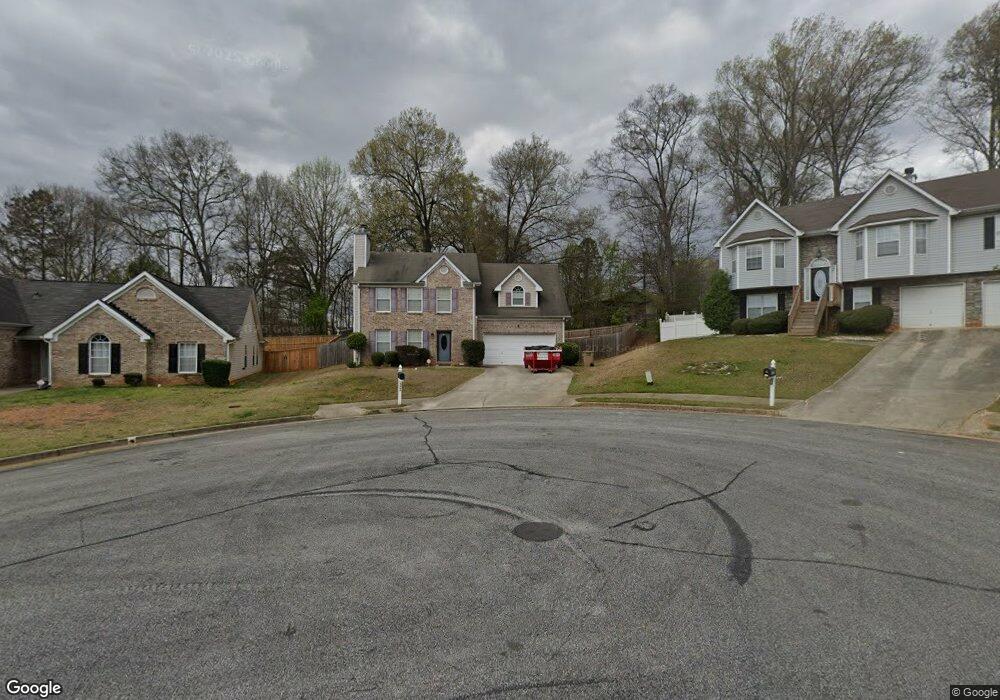
3098 Needhams Ct Unit 1 Ellenwood, GA 30294
Estimated Value: $240,000 - $324,000
3
Beds
3
Baths
1,710
Sq Ft
$170/Sq Ft
Est. Value
About This Home
This home is located at 3098 Needhams Ct Unit 1, Ellenwood, GA 30294 and is currently estimated at $291,458, approximately $170 per square foot. 3098 Needhams Ct Unit 1 is a home located in Clayton County with nearby schools including East Clayton Elementary School, Adamson Middle School, and Morrow High School.
Ownership History
Date
Name
Owned For
Owner Type
Purchase Details
Closed on
Oct 11, 2017
Sold by
Smith Shelomi D
Bought by
Mitchell-Smith Lagenia
Current Estimated Value
Purchase Details
Closed on
May 31, 2006
Sold by
Mitchell-Smity La Genia
Bought by
Mitchell-Smith La Genia and Smith Shelomi
Home Financials for this Owner
Home Financials are based on the most recent Mortgage that was taken out on this home.
Original Mortgage
$128,700
Interest Rate
6.5%
Mortgage Type
New Conventional
Purchase Details
Closed on
Dec 6, 2005
Sold by
Baker Yasmin
Bought by
Jpmorgan Chase Bk
Purchase Details
Closed on
Oct 1, 2003
Sold by
Peachtree Homes Inc
Bought by
Baker Yasmin
Home Financials for this Owner
Home Financials are based on the most recent Mortgage that was taken out on this home.
Original Mortgage
$119,840
Interest Rate
7.25%
Mortgage Type
New Conventional
Create a Home Valuation Report for This Property
The Home Valuation Report is an in-depth analysis detailing your home's value as well as a comparison with similar homes in the area
Home Values in the Area
Average Home Value in this Area
Purchase History
| Date | Buyer | Sale Price | Title Company |
|---|---|---|---|
| Mitchell-Smith Lagenia | -- | -- | |
| Mitchell-Smith La Genia | -- | -- | |
| Mitchell-Smith La Genia | $160,900 | -- | |
| Jpmorgan Chase Bk | $114,750 | -- | |
| Baker Yasmin | $149,800 | -- |
Source: Public Records
Mortgage History
| Date | Status | Borrower | Loan Amount |
|---|---|---|---|
| Previous Owner | Mitchell-Smith La Genia | $128,700 | |
| Previous Owner | Mitchell-Smith La Genia | $32,150 | |
| Previous Owner | Baker Yasmin | $119,840 |
Source: Public Records
Tax History Compared to Growth
Tax History
| Year | Tax Paid | Tax Assessment Tax Assessment Total Assessment is a certain percentage of the fair market value that is determined by local assessors to be the total taxable value of land and additions on the property. | Land | Improvement |
|---|---|---|---|---|
| 2024 | $4,365 | $110,920 | $9,600 | $101,320 |
| 2023 | $3,001 | $83,120 | $9,600 | $73,520 |
| 2022 | $3,156 | $79,440 | $9,600 | $69,840 |
| 2021 | $2,354 | $58,640 | $9,600 | $49,040 |
| 2020 | $2,207 | $54,226 | $9,600 | $44,626 |
| 2019 | $2,239 | $54,226 | $9,600 | $44,626 |
| 2018 | $2,235 | $54,130 | $9,600 | $44,530 |
| 2017 | $1,990 | $47,969 | $9,600 | $38,369 |
| 2016 | $2,065 | $49,809 | $9,600 | $40,209 |
| 2015 | $1,763 | $0 | $0 | $0 |
| 2014 | $1,662 | $40,820 | $9,600 | $31,220 |
Source: Public Records
Map
Nearby Homes
- 5578 Swanson Rd
- 5513 Emily Cir
- 2064 Panola Rd
- 5210 Katherine Village Dr
- 4637 Bouldercrest Rd
- 3491 Saddle Creek Ln Unit 1
- 3485 Saddle Creek Ln Unit 1
- 0 Grant Rd Unit 7650120
- 0 Grant Rd Unit 10605417
- 3595 Edies Way
- 0 Old Rex Morrow Rd Unit 7659496
- 0 Old Rex Morrow Rd Unit 10616003
- 3357 Bonnes Ct
- 2850 Amerson Trail
- 3587 Arminto Dr
- 5838 Highway 42
- 5514 Frontier Ct
- 3130 Rex Ridge Cir
- 5705 Laney Dr
- 3331 Waggoner Way
- 3090 Needhams Ct Unit 1
- 3102 Needhams Ct
- 3082 Needhams Ct
- 5363 Ione St
- 0 Ione St Unit 3211567
- 3101 Needhams Ct Unit 1
- 3074 Needhams Ct Unit 1
- 3081 Needhams Ct
- 5355 Ione St
- 3097 Needhams Ct Unit 1
- 3143 Jonesboro St
- 3131 Jonesboro St
- 3089 Needhams Ct Unit 1
- 3073 Needhams Ct
- 3066 Needhams Ct
- 0 Needhams Ct Unit 7405853
- 0 Needhams Ct Unit 8971387
- 3065 Needhams Ct
- 5345 Ione St
- 3058 Needhams Ct Unit 1