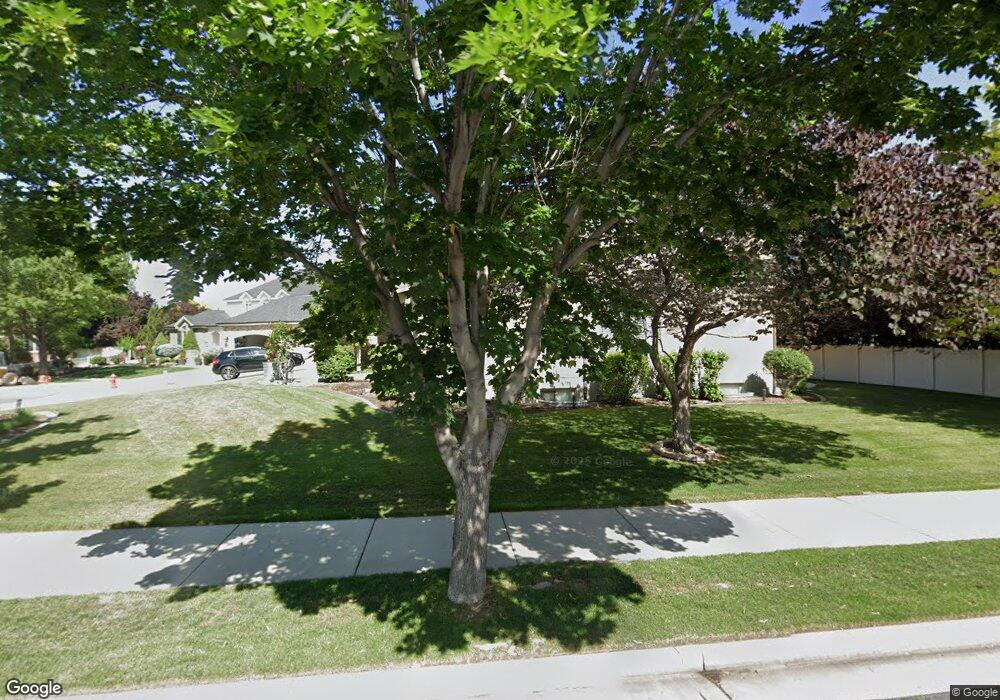
3098 Swiss Pass Cir South Jordan, UT 84095
Estimated Value: $957,084 - $1,013,000
4
Beds
3
Baths
3,329
Sq Ft
$295/Sq Ft
Est. Value
About This Home
This home is located at 3098 Swiss Pass Cir, South Jordan, UT 84095 and is currently estimated at $980,521, approximately $294 per square foot. 3098 Swiss Pass Cir is a home located in Salt Lake County with nearby schools including Monte Vista Elementary School, South Jordan Middle School, and Mountain West Montessori Academy.
Ownership History
Date
Name
Owned For
Owner Type
Purchase Details
Closed on
Jan 31, 2023
Sold by
Zheng Jin Yao and Zheng Sianny
Bought by
Jin Yao Zheng And Sianny Tan Revocable Living
Current Estimated Value
Purchase Details
Closed on
Apr 21, 2011
Sold by
Tan Sianny
Bought by
Zheng Jin Yao and Tan Sianny
Purchase Details
Closed on
Nov 16, 2005
Sold by
Ivory Homes Ltd
Bought by
Tan Sianny
Home Financials for this Owner
Home Financials are based on the most recent Mortgage that was taken out on this home.
Original Mortgage
$43,300
Interest Rate
5.93%
Mortgage Type
Credit Line Revolving
Create a Home Valuation Report for This Property
The Home Valuation Report is an in-depth analysis detailing your home's value as well as a comparison with similar homes in the area
Home Values in the Area
Average Home Value in this Area
Purchase History
| Date | Buyer | Sale Price | Title Company |
|---|---|---|---|
| Jin Yao Zheng And Sianny Tan Revocable Living | -- | -- | |
| Zheng Jin Yao | -- | Us Title Park City | |
| Tan Sianny | -- | Cottonwood Title Ins Agency | |
| Ivory Homes Ltd | -- | Cottonwood Title Ins Agency |
Source: Public Records
Mortgage History
| Date | Status | Borrower | Loan Amount |
|---|---|---|---|
| Previous Owner | Ivory Homes Ltd | $43,300 | |
| Previous Owner | Tan Sianny | $346,809 |
Source: Public Records
Tax History Compared to Growth
Tax History
| Year | Tax Paid | Tax Assessment Tax Assessment Total Assessment is a certain percentage of the fair market value that is determined by local assessors to be the total taxable value of land and additions on the property. | Land | Improvement |
|---|---|---|---|---|
| 2025 | $4,541 | $910,500 | $263,100 | $647,400 |
| 2024 | $4,541 | $862,200 | $250,600 | $611,600 |
| 2023 | $4,533 | $812,000 | $243,300 | $568,700 |
| 2022 | $4,666 | $819,300 | $238,500 | $580,800 |
| 2021 | $5,086 | $603,300 | $197,200 | $406,100 |
| 2020 | $3,682 | $556,000 | $197,200 | $358,800 |
| 2019 | $3,620 | $537,400 | $186,600 | $350,800 |
| 2018 | $3,408 | $503,400 | $185,500 | $317,900 |
| 2017 | $3,349 | $484,700 | $182,300 | $302,400 |
| 2016 | $3,504 | $480,600 | $168,500 | $312,100 |
| 2015 | $3,297 | $439,700 | $170,100 | $269,600 |
| 2014 | $3,450 | $452,100 | $162,200 | $289,900 |
Source: Public Records
Map
Nearby Homes
- 3028 W Wilkins Peak Ct
- 2834 Proudest Ln Unit 247
- 11159 Via Encantada Way
- 10827 S Logan Canyon Rd
- 10868 Reta View Ct Unit 232
- 2929 W 10755 S
- 3312 W Country Bluff Rd
- 3407 W Pazos Cir Unit 4
- 2817 W 11460 St S Unit 203
- 2866 W 10755 S
- Beatrix Plan at McKee Farms
- 10688 S Bison Creek Cove Unit 20
- 3558 W Via Bello Ct
- 2908 W Bison Ridge Rd
- 10605 Willow Valley Rd
- 2777 W Urban Ridge Rd
- 2732 W Lizzi Cove
- 3527 Haven Aire Dr
- 3550 W Franco Court #2
- 3577 Haven Hollow Dr
- 3099 Alpine Creek Ct
- 3112 Swiss Pass Cir
- 3117 Alpine Creek Ct
- 11103 Alpine Creek Way
- 11103 S Alpine Creek Way
- 11089 Alpine Creek Way
- 3113 W Swiss Pass Cir
- 3113 Swiss Pass Cir
- 11073 Alpine Creek Way
- 3129 Alpine Creek Ct
- 3107 Swiss Pass Cir
- 11093 Alta Crest Dr
- 3077 W Snow Peak Ln
- 11079 S Alta Crest Dr
- 11079 Alta Crest Dr
- 3052 W Snow Peak Ln
- 11098 S Snow Peak Ln
- 11098 S Snow Peak Ln Unit 237
- 11109 Alta Crest Dr
- 11063 Alpine Creek Way