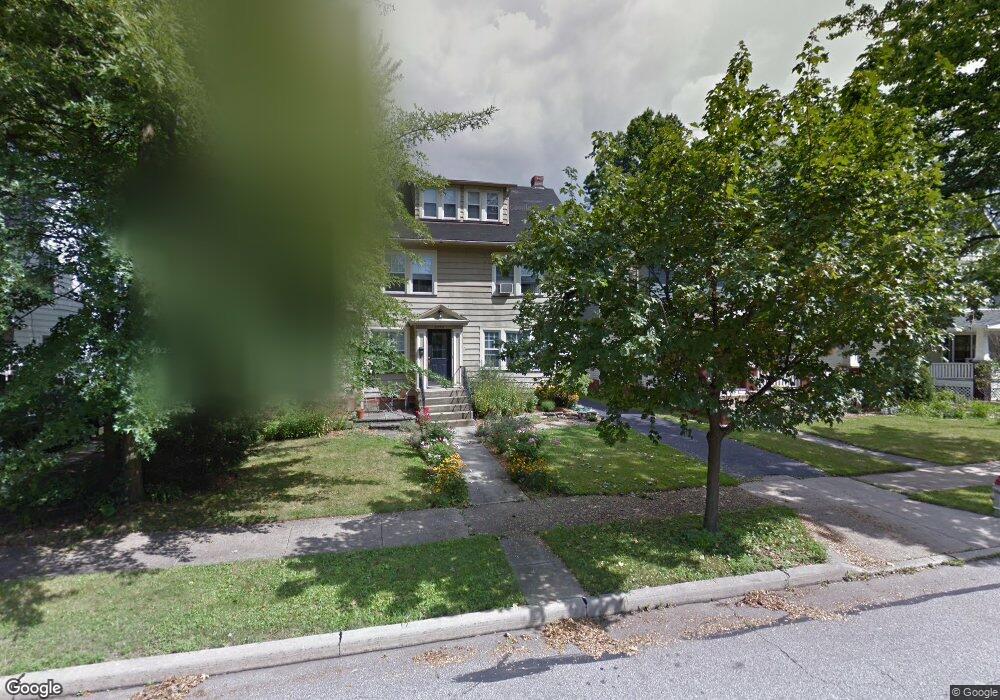
3099 Edgehill Rd Cleveland Heights, OH 44118
Estimated Value: $183,000 - $244,000
4
Beds
2
Baths
1,616
Sq Ft
$138/Sq Ft
Est. Value
About This Home
This home is located at 3099 Edgehill Rd, Cleveland Heights, OH 44118 and is currently estimated at $223,343, approximately $138 per square foot. 3099 Edgehill Rd is a home located in Cuyahoga County with nearby schools including Boulevard Elementary School, Roxboro Middle School, and Cleveland Heights High School.
Ownership History
Date
Name
Owned For
Owner Type
Purchase Details
Closed on
May 30, 2006
Sold by
Loue Sana
Bought by
Fortney Cara
Current Estimated Value
Purchase Details
Closed on
Mar 9, 2002
Sold by
Hakim Sajid
Bought by
Loue Sana
Purchase Details
Closed on
Jan 26, 1994
Sold by
Harris Ronald
Bought by
Loue Sana
Purchase Details
Closed on
Aug 4, 1989
Sold by
Madorsky Michael J
Bought by
Harris Ronald
Purchase Details
Closed on
Jan 31, 1989
Bought by
Madorsky Michael J
Purchase Details
Closed on
Sep 21, 1988
Sold by
Brown Donald W
Bought by
Secretary Of H.U.D
Purchase Details
Closed on
Apr 28, 1982
Sold by
Careaga Roger
Bought by
Brown Donald W
Purchase Details
Closed on
May 14, 1980
Sold by
Depriest Lonnie
Bought by
Careaga Roger
Purchase Details
Closed on
Mar 30, 1976
Sold by
Depriest Lonnie and Depriest F
Bought by
Depriest Lonnie
Purchase Details
Closed on
Jan 1, 1975
Bought by
Depriest Lonnie and Depriest F
Create a Home Valuation Report for This Property
The Home Valuation Report is an in-depth analysis detailing your home's value as well as a comparison with similar homes in the area
Home Values in the Area
Average Home Value in this Area
Purchase History
| Date | Buyer | Sale Price | Title Company |
|---|---|---|---|
| Fortney Cara | $125,000 | Chicago Title Insurance C | |
| Loue Sana | -- | -- | |
| Loue Sana | $83,000 | -- | |
| Harris Ronald | $65,900 | -- | |
| Madorsky Michael J | -- | -- | |
| Secretary Of H.U.D | -- | -- | |
| Brown Donald W | $61,500 | -- | |
| Careaga Roger | $32,800 | -- | |
| Depriest Lonnie | -- | -- | |
| Depriest Lonnie | -- | -- |
Source: Public Records
Tax History Compared to Growth
Tax History
| Year | Tax Paid | Tax Assessment Tax Assessment Total Assessment is a certain percentage of the fair market value that is determined by local assessors to be the total taxable value of land and additions on the property. | Land | Improvement |
|---|---|---|---|---|
| 2024 | $6,370 | $75,145 | $15,120 | $60,025 |
| 2023 | $5,994 | $55,200 | $12,640 | $42,560 |
| 2022 | $5,963 | $55,200 | $12,640 | $42,560 |
| 2021 | $5,842 | $55,200 | $12,640 | $42,560 |
| 2020 | $5,770 | $49,280 | $11,270 | $38,010 |
| 2019 | $5,450 | $140,800 | $32,200 | $108,600 |
| 2018 | $5,453 | $49,280 | $11,270 | $38,010 |
| 2017 | $5,256 | $44,140 | $9,490 | $34,650 |
| 2016 | $5,246 | $44,140 | $9,490 | $34,650 |
| 2015 | $4,612 | $44,140 | $9,490 | $34,650 |
| 2014 | $4,612 | $40,890 | $8,790 | $32,100 |
Source: Public Records
Map
Nearby Homes
- 1901 Parkway Dr
- 3115 Lincoln Blvd
- 3054 E Overlook Rd
- 14450 Superior Rd
- 3094 Berkshire Rd
- 3048 Euclid Heights Blvd
- 3219 E Overlook Rd
- 3007 Edgehill Rd
- 3243 Yorkshire Rd
- 3262 E Overlook Rd
- 2100 Cottage Grove Dr
- 3258 Berkshire Rd
- 3175 E Derbyshire Rd
- 1890 Woodward Ave
- 3270 Berkshire Rd
- 3156 E Derbyshire Rd
- 3215 Euclid Heights Blvd
- 2940 Somerton Rd
- 3286 Yorkshire Rd
- 3310 E Overlook Rd
- 3103 Edgehill Rd
- 3093 Edgehill Rd
- 3107 Edgehill Rd
- 3087 Edgehill Rd
- 3113 Edgehill Rd
- 3083 Edgehill Rd
- 3090 Lincoln Blvd
- 3104 Lincoln Blvd
- 3100 Edgehill Rd
- 3096 Edgehill Rd
- 3086 Lincoln Blvd
- 3088 Edgehill Rd
- 3115 Edgehill Rd
- 3108 Lincoln Blvd
- 3108 Edgehill Rd
- 3082 Lincoln Blvd
- 3084 Edgehill Rd
- 3075 Edgehill Rd
- 3073 Edgehill Rd
- 3114 Edgehill Rd