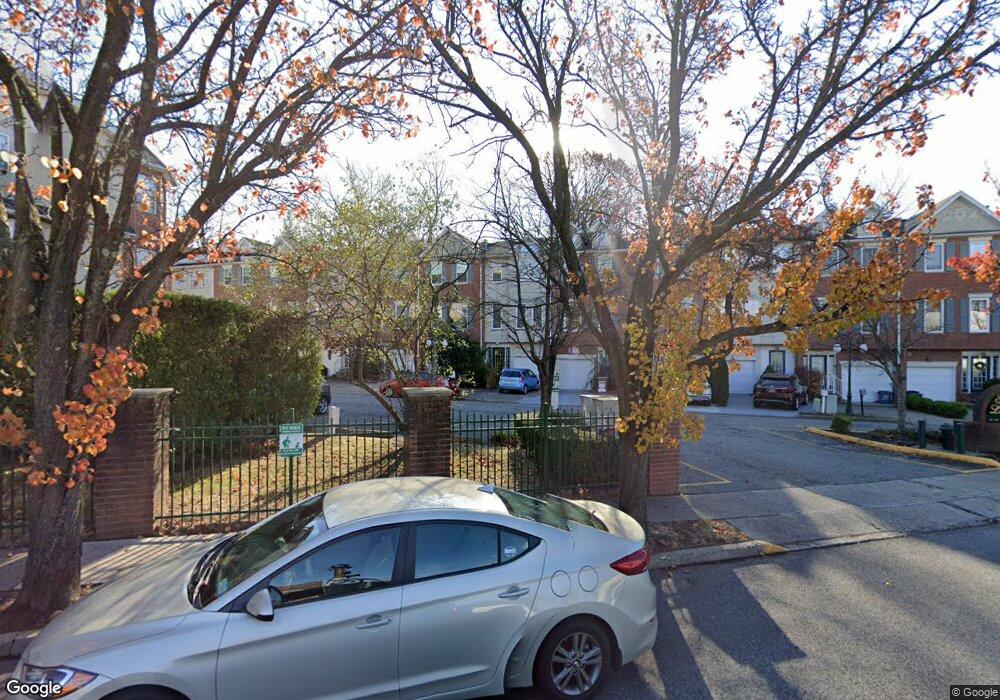
31-45 Galvaston Loop Staten Island, NY 10314
New Springville NeighborhoodEstimated Value: $732,218 - $833,000
4
Beds
3
Baths
2,175
Sq Ft
$370/Sq Ft
Est. Value
About This Home
This home is located at 31-45 Galvaston Loop, Staten Island, NY 10314 and is currently estimated at $805,555, approximately $370 per square foot. 31-45 Galvaston Loop is a home located in Richmond County with nearby schools including P.S. 58R Space Shuttle Columbia School, Is 72 Rocco Laurie, and Port Richmond High School.
Ownership History
Date
Name
Owned For
Owner Type
Purchase Details
Closed on
Apr 9, 2015
Sold by
Failla Roy
Bought by
Kapelman Roman
Current Estimated Value
Home Financials for this Owner
Home Financials are based on the most recent Mortgage that was taken out on this home.
Original Mortgage
$441,595
Outstanding Balance
$332,463
Interest Rate
3.62%
Mortgage Type
FHA
Estimated Equity
$473,092
Purchase Details
Closed on
Jan 22, 2003
Sold by
Brody Kevin P
Bought by
Failla Roy
Home Financials for this Owner
Home Financials are based on the most recent Mortgage that was taken out on this home.
Original Mortgage
$296,000
Interest Rate
5.9%
Mortgage Type
Purchase Money Mortgage
Purchase Details
Closed on
Jun 9, 1999
Sold by
Mauriello Neil and Mauriello Margaret
Bought by
Brody Kevin P
Home Financials for this Owner
Home Financials are based on the most recent Mortgage that was taken out on this home.
Original Mortgage
$21,517
Interest Rate
7.65%
Create a Home Valuation Report for This Property
The Home Valuation Report is an in-depth analysis detailing your home's value as well as a comparison with similar homes in the area
Home Values in the Area
Average Home Value in this Area
Purchase History
| Date | Buyer | Sale Price | Title Company |
|---|---|---|---|
| Kapelman Roman | $450,000 | The Judicial Title Ins Agenc | |
| Failla Roy | $370,000 | Omni Title | |
| Brody Kevin P | $72,000 | Regal Title Agency |
Source: Public Records
Mortgage History
| Date | Status | Borrower | Loan Amount |
|---|---|---|---|
| Open | Kapelman Roman | $441,595 | |
| Previous Owner | Failla Roy | $296,000 | |
| Previous Owner | Brody Kevin P | $21,517 |
Source: Public Records
Tax History
| Year | Tax Paid | Tax Assessment Tax Assessment Total Assessment is a certain percentage of the fair market value that is determined by local assessors to be the total taxable value of land and additions on the property. | Land | Improvement |
|---|---|---|---|---|
| 2025 | $5,810 | $42,000 | $4,030 | $37,970 |
| 2024 | $5,810 | $41,220 | $3,874 | $37,346 |
| 2023 | $5,542 | $27,288 | $3,252 | $24,036 |
| 2022 | $5,448 | $41,220 | $5,520 | $35,700 |
| 2021 | $5,700 | $41,040 | $5,520 | $35,520 |
| 2020 | $5,408 | $36,780 | $5,520 | $31,260 |
| 2019 | $5,042 | $31,980 | $5,520 | $26,460 |
| 2018 | $4,636 | $22,740 | $5,520 | $17,220 |
| 2017 | $4,709 | $23,100 | $5,520 | $17,580 |
| 2016 | $5,000 | $25,010 | $5,079 | $19,931 |
| 2015 | $4,272 | $23,595 | $4,205 | $19,390 |
| 2014 | $4,272 | $22,260 | $4,081 | $18,179 |
Source: Public Records
Map
Nearby Homes
- 40 Wellington Ct Unit 2A
- 95 Essex Dr Unit 3H
- 43 Pierpont Place Unit 331B
- 31 Pierpont Place Unit 357E
- 205 Essex Dr
- 139 Pierpont Place Unit 213
- 1752 Forest Hill Rd Unit 198F
- 171 Wellington Ct Unit 3B
- 120 Devon Loop Unit 6
- 271 Kelly Blvd
- 160 Devon Loop Unit 5
- 170 Devon Loop Unit 4
- 1632 Forest Hill Rd
- 155 Devon Loop Unit A
- 1596 Forest Hill Rd
- 65 Elmwood Park Dr Unit 20
- 85 Elmwood Park Dr Unit 23
- 85 Elmwood Park Dr Unit 30
- 1818 Forest Hill Rd
- 17 Gregory Ln Unit A
- 31 Galvaston Loop Unit 45
- 31 Galvaston Loop
- 31 Galvaston Loop
- 29 Galvaston Loop
- 33 Galvaston Loop
- 27 Galvaston Loop
- 35 Galvaston Loop Unit 45
- 35-45 Galvaston Loop
- 25 Galvaston Loop
- 37 Galvaston Loop
- 23 Galvaston Loop
- 39 Galvaston Loop Unit 45
- 39-45 Galvaston Loop
- 21 Galvaston Loop
- 41 Galvaston Loop
- 43 Galvaston Loop
- 19 Galvaston Loop
- 45 Galvaston Loop
- 34 Galvaston Loop
- 17 Galvaston Loop
Your Personal Tour Guide
Ask me questions while you tour the home.