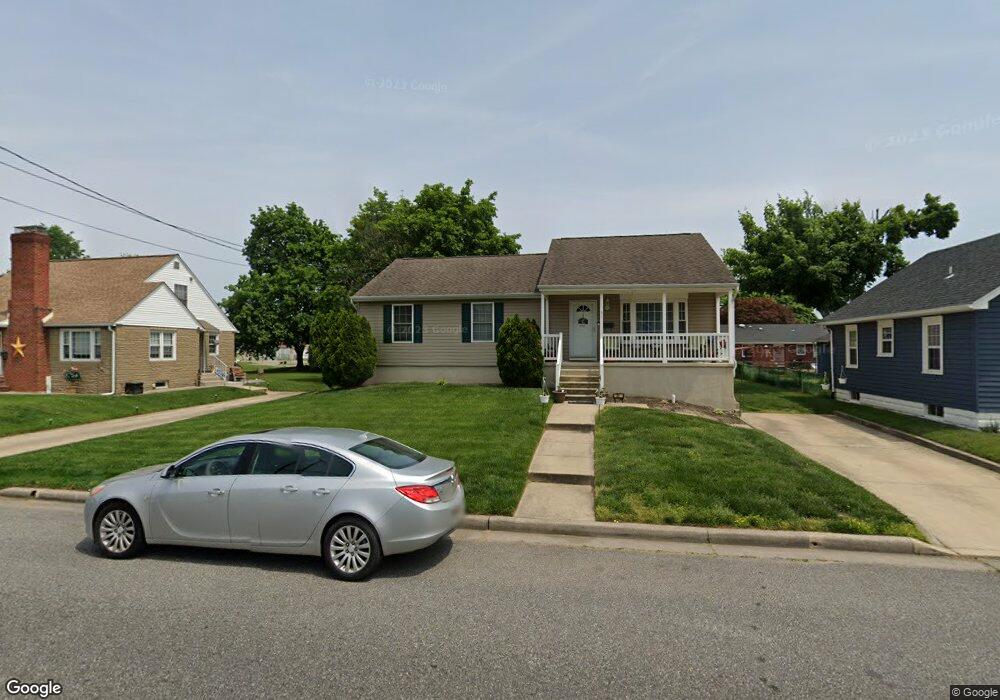
31 6th Ave Penns Grove, NJ 08069
Estimated Value: $183,810 - $317,000
--
Bed
--
Bath
1,260
Sq Ft
$215/Sq Ft
Est. Value
About This Home
This home is located at 31 6th Ave, Penns Grove, NJ 08069 and is currently estimated at $270,953, approximately $215 per square foot. 31 6th Ave is a home located in Salem County with nearby schools including Lafayette-Pershing Elementary School, Field Street Elementary School, and Paul W. Carleton Elementary School.
Ownership History
Date
Name
Owned For
Owner Type
Purchase Details
Closed on
Sep 24, 2021
Sold by
Leake Latika Monique and Dowe Latika M
Bought by
Leake Latika Monique
Current Estimated Value
Home Financials for this Owner
Home Financials are based on the most recent Mortgage that was taken out on this home.
Original Mortgage
$112,500
Outstanding Balance
$71,235
Interest Rate
2.8%
Mortgage Type
New Conventional
Estimated Equity
$199,718
Purchase Details
Closed on
Oct 21, 2005
Sold by
Sbs Investments Llc
Bought by
Dowe Latika M
Home Financials for this Owner
Home Financials are based on the most recent Mortgage that was taken out on this home.
Original Mortgage
$133,500
Interest Rate
6%
Mortgage Type
Fannie Mae Freddie Mac
Purchase Details
Closed on
Jun 6, 2005
Sold by
Sbs Investments Llc
Bought by
Sbs Investments Llc
Create a Home Valuation Report for This Property
The Home Valuation Report is an in-depth analysis detailing your home's value as well as a comparison with similar homes in the area
Home Values in the Area
Average Home Value in this Area
Purchase History
| Date | Buyer | Sale Price | Title Company |
|---|---|---|---|
| Leake Latika Monique | -- | Res Title Inc | |
| Dowe Latika M | $150,000 | West Jersey Title Agency | |
| Sbs Investments Llc | -- | West Jersey Title Agency |
Source: Public Records
Mortgage History
| Date | Status | Borrower | Loan Amount |
|---|---|---|---|
| Open | Leake Latika Monique | $112,500 | |
| Closed | Dowe Latika M | $133,500 |
Source: Public Records
Tax History Compared to Growth
Tax History
| Year | Tax Paid | Tax Assessment Tax Assessment Total Assessment is a certain percentage of the fair market value that is determined by local assessors to be the total taxable value of land and additions on the property. | Land | Improvement |
|---|---|---|---|---|
| 2025 | $5,199 | $262,300 | $52,200 | $210,100 |
| 2024 | $5,020 | $141,000 | $30,300 | $110,700 |
| 2023 | $5,020 | $141,000 | $30,300 | $110,700 |
| 2022 | $4,724 | $141,000 | $30,300 | $110,700 |
| 2021 | $4,678 | $141,000 | $30,300 | $110,700 |
| 2020 | $4,719 | $141,000 | $30,300 | $110,700 |
| 2019 | $4,759 | $141,000 | $30,300 | $110,700 |
| 2018 | $4,308 | $136,800 | $33,600 | $103,200 |
| 2017 | $4,016 | $136,800 | $33,600 | $103,200 |
| 2016 | $4,425 | $156,400 | $38,600 | $117,800 |
| 2015 | $4,218 | $156,400 | $38,600 | $117,800 |
| 2014 | $3,993 | $156,400 | $38,600 | $117,800 |
Source: Public Records
Map
Nearby Homes
- 28 4th Ave
- 81 7th Ave
- 51 Washington Ave
- 59 61 Broad St
- 279 Pine St
- 113 N Broad St
- 71 Poplar St
- 27 E Line St
- 303 Pine St
- 311 Pine St
- 18 Pearl St
- 31 Elvin Ave
- 89 Delaware Ave
- 87 W Pitman St
- 54 W Pitman St
- 111 Grove St
- 142 N Dolbow Ave
- 102 Delaware Ave Unit FRONT
- 6 W Griffith St
- 136 Penns Grove Auburn Rd