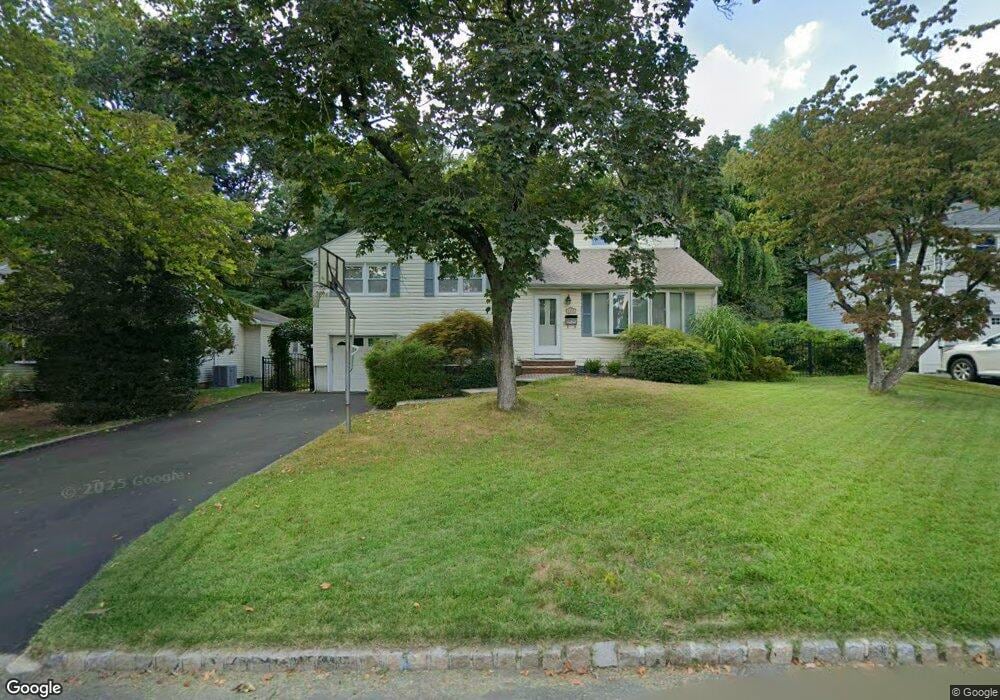
31 Alcott Dr Livingston, NJ 07039
Estimated Value: $905,000 - $1,107,000
--
Bed
--
Bath
1,886
Sq Ft
$536/Sq Ft
Est. Value
About This Home
This home is located at 31 Alcott Dr, Livingston, NJ 07039 and is currently estimated at $1,011,111, approximately $536 per square foot. 31 Alcott Dr is a home located in Essex County with nearby schools including Livingston Sr High School and Aquinas Academy.
Ownership History
Date
Name
Owned For
Owner Type
Purchase Details
Closed on
Aug 17, 2014
Sold by
Stolze Elizabeth
Bought by
Stolze Frank
Current Estimated Value
Purchase Details
Closed on
Sep 1, 2009
Sold by
Zappulla Joseph and Zappulla Dona
Bought by
Stolze Frank and Stolze Elizabeth
Home Financials for this Owner
Home Financials are based on the most recent Mortgage that was taken out on this home.
Original Mortgage
$400,000
Interest Rate
4.5%
Mortgage Type
New Conventional
Purchase Details
Closed on
Dec 1, 2003
Sold by
Mcdonald Louis
Bought by
Zappulla Joseph and Zappulla Dona
Home Financials for this Owner
Home Financials are based on the most recent Mortgage that was taken out on this home.
Original Mortgage
$310,000
Interest Rate
5.96%
Create a Home Valuation Report for This Property
The Home Valuation Report is an in-depth analysis detailing your home's value as well as a comparison with similar homes in the area
Home Values in the Area
Average Home Value in this Area
Purchase History
| Date | Buyer | Sale Price | Title Company |
|---|---|---|---|
| Stolze Frank | $126,000 | -- | |
| Stolze Frank | $126,000 | -- | |
| Stolze Frank | $515,000 | None Available | |
| Zappulla Joseph | $412,500 | -- |
Source: Public Records
Mortgage History
| Date | Status | Borrower | Loan Amount |
|---|---|---|---|
| Previous Owner | Stolze Frank | $400,000 | |
| Previous Owner | Zappulla Joseph | $310,000 |
Source: Public Records
Tax History Compared to Growth
Tax History
| Year | Tax Paid | Tax Assessment Tax Assessment Total Assessment is a certain percentage of the fair market value that is determined by local assessors to be the total taxable value of land and additions on the property. | Land | Improvement |
|---|---|---|---|---|
| 2025 | $11,129 | $469,200 | $283,200 | $186,000 |
| 2024 | $11,129 | $469,200 | $283,200 | $186,000 |
| 2022 | $10,946 | $469,200 | $283,200 | $186,000 |
| 2021 | $10,857 | $469,200 | $283,200 | $186,000 |
| 2020 | $10,656 | $469,200 | $283,200 | $186,000 |
| 2019 | $11,126 | $425,300 | $283,200 | $142,100 |
| 2018 | $10,977 | $425,300 | $283,200 | $142,100 |
| 2017 | $10,832 | $425,300 | $283,200 | $142,100 |
| 2016 | $10,633 | $425,300 | $283,200 | $142,100 |
| 2015 | $10,475 | $425,300 | $283,200 | $142,100 |
| 2014 | $10,135 | $425,300 | $283,200 | $142,100 |
Source: Public Records
Map
Nearby Homes
- 41 W Mcclellan Ave
- 52 Congressional Pkwy
- 141 Madison Ct
- 45 Brandon Ave
- 6 Elkin Dr
- 24 Cliffside Dr
- 6 Mayhew Dr
- 37 Filmore Ave
- 10 Elmwood Ct
- 27 Filmore Ave
- 6 Mulford Ct Unit Address 6
- 6 Mulford Ct Unit C0013
- 26 Kent Dr Unit C0145
- 53 Rockledge Dr
- 91 Keyes Rd
- 44 Lincoln Ave
- 36 Crestview Hill Rd
- 88 Kent Dr Unit C0176
- 18 Harkey Ct Unit 63
- 18 Harkey Ct Unit C0063