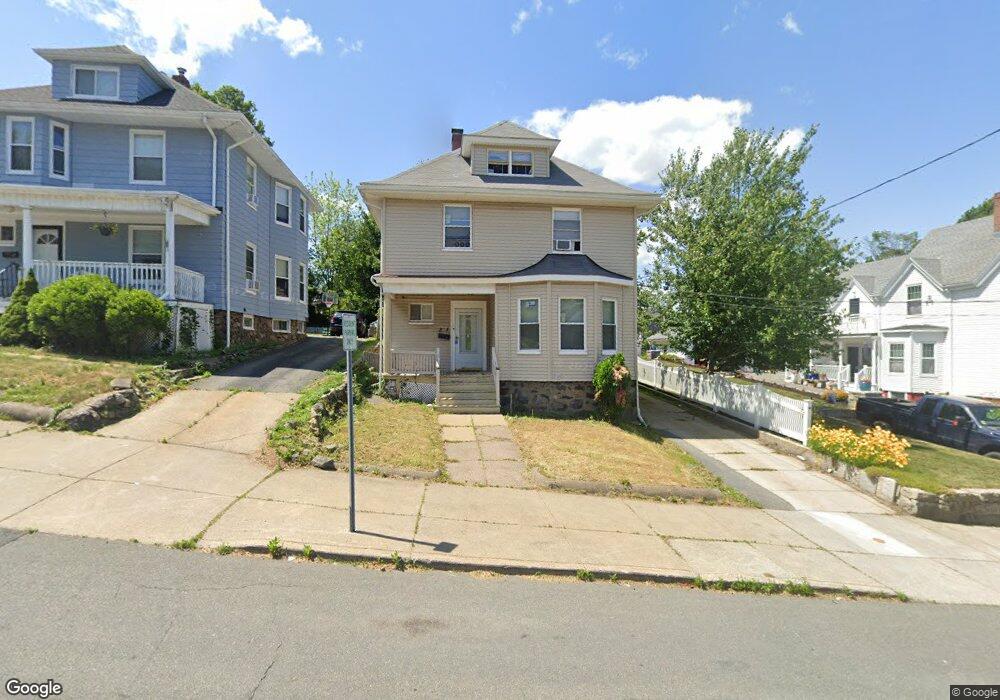
31 Allen Ave Lynn, MA 01902
Agganis AC NeighborhoodEstimated Value: $545,000 - $559,239
3
Beds
1
Bath
1,550
Sq Ft
$356/Sq Ft
Est. Value
About This Home
This home is located at 31 Allen Ave, Lynn, MA 01902 and is currently estimated at $551,060, approximately $355 per square foot. 31 Allen Ave is a home located in Essex County with nearby schools including Robert L. Ford Elementary School, William R. Fallon School, and Marshall Middle School.
Ownership History
Date
Name
Owned For
Owner Type
Purchase Details
Closed on
Feb 6, 2008
Sold by
Shereni Marian S
Bought by
Us Bk
Current Estimated Value
Purchase Details
Closed on
Oct 31, 2003
Sold by
Argant Alvino J F and Argant Odette
Bought by
Shereni Marian S
Purchase Details
Closed on
Mar 11, 1996
Sold by
Whittemore Elizabeth
Bought by
Argant Alvin and Payen Odette
Purchase Details
Closed on
Jan 12, 1987
Sold by
Kidder Marian D
Bought by
Whittemore Elizabeth
Create a Home Valuation Report for This Property
The Home Valuation Report is an in-depth analysis detailing your home's value as well as a comparison with similar homes in the area
Home Values in the Area
Average Home Value in this Area
Purchase History
| Date | Buyer | Sale Price | Title Company |
|---|---|---|---|
| Us Bk | $202,500 | -- | |
| Us Bk | $202,500 | -- | |
| Shereni Marian S | $245,000 | -- | |
| Shereni Marian S | $245,000 | -- | |
| Argant Alvin | $85,000 | -- | |
| Argant Alvin | $85,000 | -- | |
| Whittemore Elizabeth | $112,000 | -- |
Source: Public Records
Mortgage History
| Date | Status | Borrower | Loan Amount |
|---|---|---|---|
| Open | Whittemore Elizabeth | $157,250 | |
| Closed | Whittemore Elizabeth | $157,700 |
Source: Public Records
Tax History
| Year | Tax Paid | Tax Assessment Tax Assessment Total Assessment is a certain percentage of the fair market value that is determined by local assessors to be the total taxable value of land and additions on the property. | Land | Improvement |
|---|---|---|---|---|
| 2025 | $5,607 | $541,200 | $201,700 | $339,500 |
| 2024 | $5,173 | $491,300 | $182,000 | $309,300 |
| 2023 | $4,809 | $431,300 | $182,000 | $249,300 |
| 2022 | $4,757 | $382,700 | $148,900 | $233,800 |
| 2021 | $4,490 | $344,600 | $135,800 | $208,800 |
| 2020 | $4,071 | $303,800 | $106,100 | $197,700 |
| 2019 | $3,895 | $272,400 | $103,500 | $168,900 |
| 2018 | $3,754 | $247,800 | $100,000 | $147,800 |
| 2017 | $3,537 | $226,700 | $77,700 | $149,000 |
| 2016 | $3,262 | $201,600 | $65,500 | $136,100 |
| 2015 | $3,162 | $188,800 | $70,300 | $118,500 |
Source: Public Records
Map
Nearby Homes
Your Personal Tour Guide
Ask me questions while you tour the home.