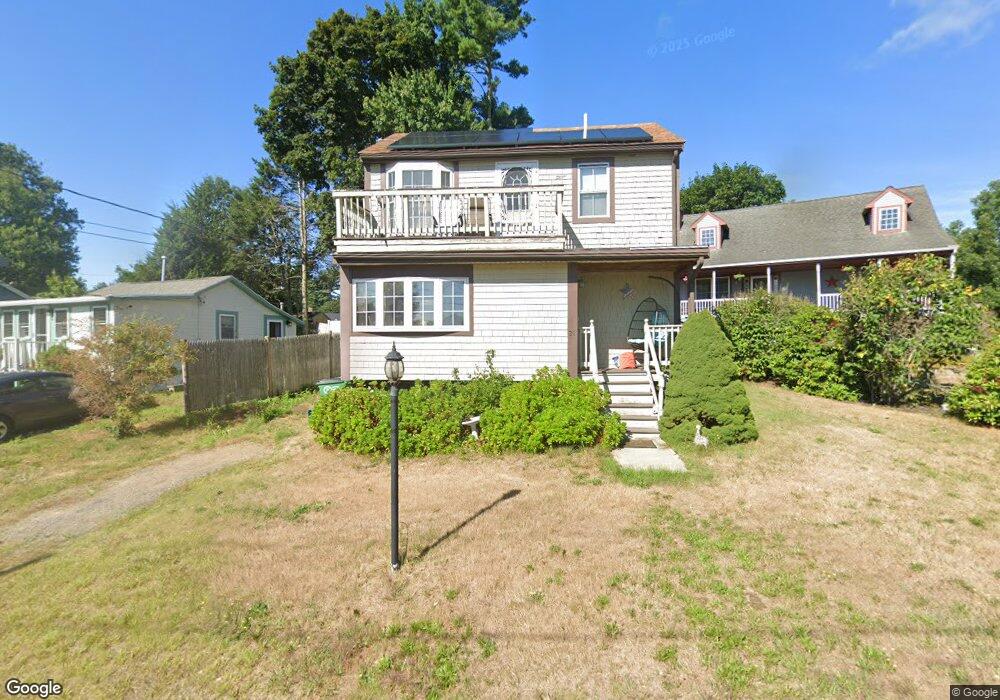
31 Alvern Rd Pembroke, MA 02359
Estimated Value: $477,000 - $571,000
2
Beds
2
Baths
1,232
Sq Ft
$422/Sq Ft
Est. Value
About This Home
This home is located at 31 Alvern Rd, Pembroke, MA 02359 and is currently estimated at $519,706, approximately $421 per square foot. 31 Alvern Rd is a home located in Plymouth County with nearby schools including Pembroke High School.
Ownership History
Date
Name
Owned For
Owner Type
Purchase Details
Closed on
May 10, 2007
Sold by
Murphy Michael J
Bought by
Monahan Cein E
Current Estimated Value
Home Financials for this Owner
Home Financials are based on the most recent Mortgage that was taken out on this home.
Original Mortgage
$198,000
Interest Rate
6.21%
Mortgage Type
Purchase Money Mortgage
Purchase Details
Closed on
May 10, 2000
Sold by
Siraco Joseph A
Bought by
Murphy Michael J
Create a Home Valuation Report for This Property
The Home Valuation Report is an in-depth analysis detailing your home's value as well as a comparison with similar homes in the area
Home Values in the Area
Average Home Value in this Area
Purchase History
| Date | Buyer | Sale Price | Title Company |
|---|---|---|---|
| Monahan Cein E | $264,000 | -- | |
| Murphy Michael J | $122,000 | -- |
Source: Public Records
Mortgage History
| Date | Status | Borrower | Loan Amount |
|---|---|---|---|
| Open | Murphy Michael J | $262,500 | |
| Closed | Murphy Michael J | $198,000 | |
| Closed | Murphy Michael J | $66,000 |
Source: Public Records
Tax History Compared to Growth
Tax History
| Year | Tax Paid | Tax Assessment Tax Assessment Total Assessment is a certain percentage of the fair market value that is determined by local assessors to be the total taxable value of land and additions on the property. | Land | Improvement |
|---|---|---|---|---|
| 2025 | $5,206 | $433,100 | $263,400 | $169,700 |
| 2024 | $4,818 | $400,500 | $231,600 | $168,900 |
| 2023 | $4,547 | $357,500 | $212,400 | $145,100 |
| 2022 | $4,125 | $291,500 | $162,100 | $129,400 |
| 2021 | $4,151 | $284,700 | $162,100 | $122,600 |
| 2020 | $4,035 | $278,500 | $158,400 | $120,100 |
| 2019 | $3,962 | $271,400 | $158,400 | $113,000 |
| 2018 | $3,807 | $255,700 | $149,000 | $106,700 |
| 2017 | $3,737 | $247,500 | $141,800 | $105,700 |
| 2016 | $3,507 | $229,800 | $123,500 | $106,300 |
| 2015 | $3,398 | $230,500 | $123,500 | $107,000 |
Source: Public Records
Map
Nearby Homes