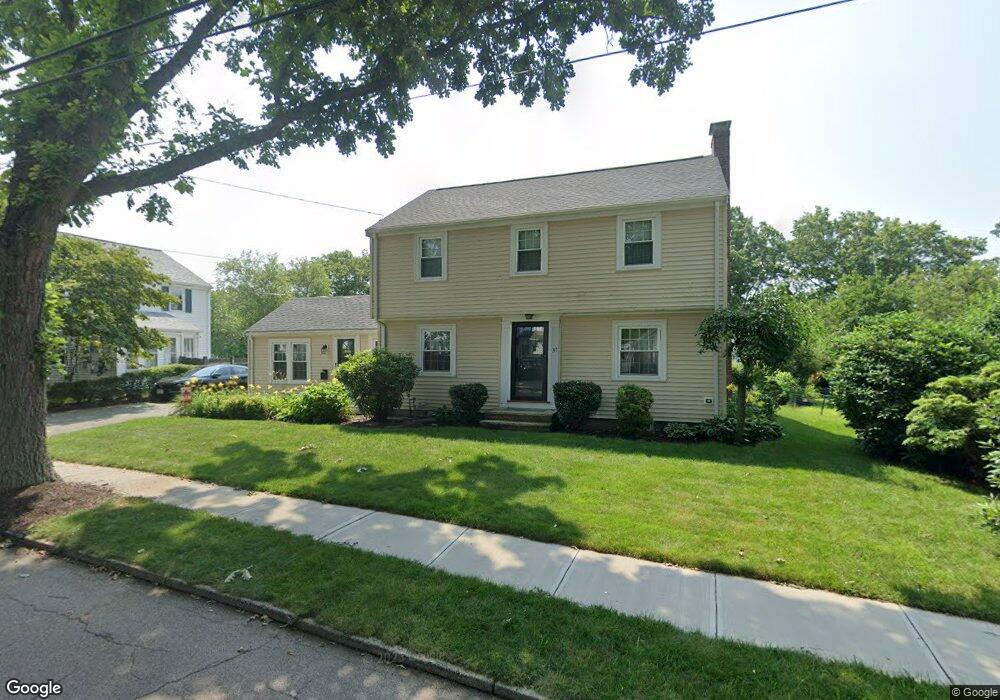
31 Andrews Rd Quincy, MA 02170
Wollaston NeighborhoodEstimated Value: $800,211 - $831,000
3
Beds
3
Baths
1,678
Sq Ft
$487/Sq Ft
Est. Value
About This Home
This home is located at 31 Andrews Rd, Quincy, MA 02170 and is currently estimated at $817,053, approximately $486 per square foot. 31 Andrews Rd is a home located in Norfolk County with nearby schools including Beechwood Knoll Elementary School, Central Middle School, and North Quincy High School.
Ownership History
Date
Name
Owned For
Owner Type
Purchase Details
Closed on
Apr 15, 2005
Sold by
Duffy Joseph R and Duffy Marlene R
Bought by
Smith Harry S and Smith Renee M
Current Estimated Value
Home Financials for this Owner
Home Financials are based on the most recent Mortgage that was taken out on this home.
Original Mortgage
$245,000
Outstanding Balance
$126,430
Interest Rate
5.78%
Mortgage Type
Purchase Money Mortgage
Estimated Equity
$690,623
Create a Home Valuation Report for This Property
The Home Valuation Report is an in-depth analysis detailing your home's value as well as a comparison with similar homes in the area
Home Values in the Area
Average Home Value in this Area
Purchase History
| Date | Buyer | Sale Price | Title Company |
|---|---|---|---|
| Smith Harry S | $459,000 | -- |
Source: Public Records
Mortgage History
| Date | Status | Borrower | Loan Amount |
|---|---|---|---|
| Open | Smith Harry S | $245,000 | |
| Closed | Smith Harry S | $50,000 |
Source: Public Records
Tax History Compared to Growth
Tax History
| Year | Tax Paid | Tax Assessment Tax Assessment Total Assessment is a certain percentage of the fair market value that is determined by local assessors to be the total taxable value of land and additions on the property. | Land | Improvement |
|---|---|---|---|---|
| 2025 | $7,919 | $686,800 | $353,000 | $333,800 |
| 2024 | $7,666 | $680,200 | $353,000 | $327,200 |
| 2023 | $7,137 | $641,200 | $336,200 | $305,000 |
| 2022 | $6,637 | $554,000 | $268,900 | $285,100 |
| 2021 | $6,603 | $543,900 | $268,900 | $275,000 |
| 2020 | $6,512 | $523,900 | $268,900 | $255,000 |
| 2019 | $6,171 | $491,700 | $251,300 | $240,400 |
| 2018 | $6,022 | $451,400 | $228,500 | $222,900 |
| 2017 | $6,107 | $431,000 | $228,500 | $202,500 |
| 2016 | $5,803 | $404,100 | $207,700 | $196,400 |
| 2015 | $5,396 | $369,600 | $188,800 | $180,800 |
| 2014 | $5,103 | $343,400 | $179,800 | $163,600 |
Source: Public Records
Map
Nearby Homes
- 14 Ridgeway St
- 100 Thornton St
- 41 Randlett St
- 123 Waterston Ave
- 72 Waterston Ave
- 35 Estabrook Rd
- 65 - 67 Davis St
- 14 Maypole Rd
- 158 W Elm Ave
- 88 Furnace Brook Pkwy
- 1333 Quincy Shore Dr
- 101 Beach St
- 80 Squanto Rd
- 77 Samoset Ave
- 22 Beach St
- 4 Agawam Rd
- 14 Samoset Ave
- 33 Samoset Ave
- 43 Ellington Rd
- 22 Newton Ave