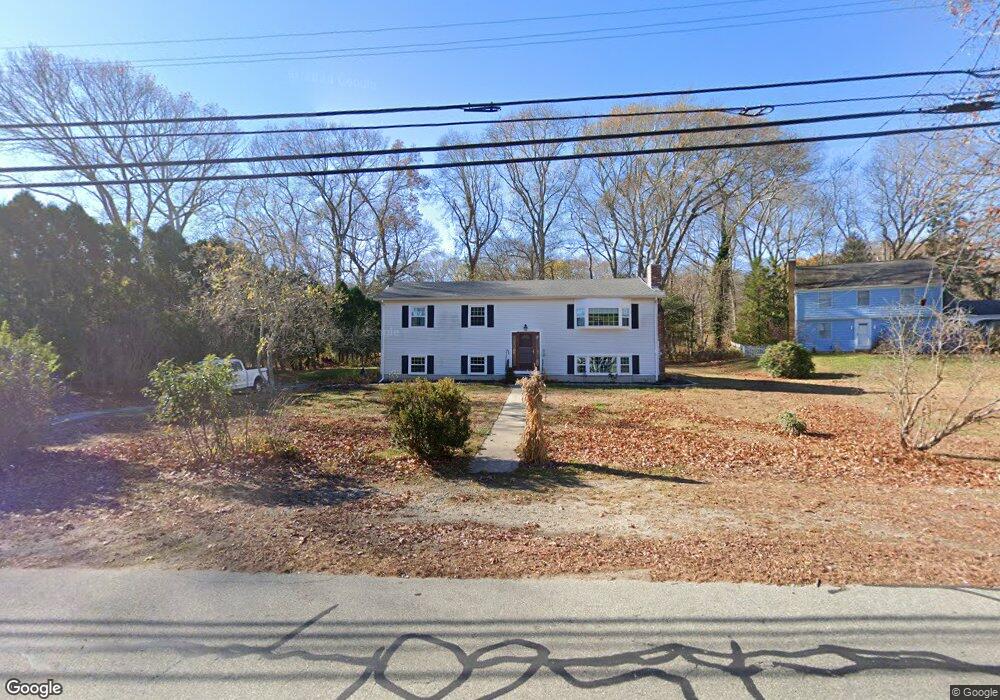
31 Attawan Rd Niantic, CT 06357
Estimated Value: $442,000 - $631,000
4
Beds
3
Baths
1,344
Sq Ft
$398/Sq Ft
Est. Value
About This Home
This home is located at 31 Attawan Rd, Niantic, CT 06357 and is currently estimated at $535,077, approximately $398 per square foot. 31 Attawan Rd is a home located in New London County with nearby schools including East Lyme Middle School, East Lyme High School, and The Light House Voc-Ed Center.
Ownership History
Date
Name
Owned For
Owner Type
Purchase Details
Closed on
Jul 28, 2022
Sold by
Brentlinger Janice V Est and Brentlinger
Bought by
Benson Debra I and Benson Lamont
Current Estimated Value
Create a Home Valuation Report for This Property
The Home Valuation Report is an in-depth analysis detailing your home's value as well as a comparison with similar homes in the area
Home Values in the Area
Average Home Value in this Area
Purchase History
| Date | Buyer | Sale Price | Title Company |
|---|---|---|---|
| Benson Debra I | $317,495 | None Available | |
| Benson Debra I | $317,495 | None Available |
Source: Public Records
Tax History
| Year | Tax Paid | Tax Assessment Tax Assessment Total Assessment is a certain percentage of the fair market value that is determined by local assessors to be the total taxable value of land and additions on the property. | Land | Improvement |
|---|---|---|---|---|
| 2025 | $5,974 | $213,290 | $90,300 | $122,990 |
| 2024 | $5,620 | $213,290 | $90,300 | $122,990 |
| 2023 | $5,138 | $206,500 | $90,300 | $116,200 |
| 2022 | $4,923 | $206,500 | $90,300 | $116,200 |
| 2021 | $4,937 | $173,180 | $86,170 | $87,010 |
| 2020 | $4,911 | $173,180 | $86,170 | $87,010 |
| 2019 | $4,882 | $173,180 | $86,170 | $87,010 |
| 2018 | $4,736 | $173,180 | $86,170 | $87,010 |
| 2017 | $4,530 | $173,180 | $86,170 | $87,010 |
| 2016 | $4,976 | $196,210 | $106,680 | $89,530 |
| 2015 | $4,848 | $196,210 | $106,680 | $89,530 |
| 2014 | $4,715 | $196,210 | $106,680 | $89,530 |
Source: Public Records
Map
Nearby Homes
- 36 Attawan Rd
- 26 Mohawk Dr
- 127 Black Point Rd Unit 7
- 42 S Washington Ave
- 61 Whitecap Rd
- 19 Sapia Dr
- 468 Main St Unit 318
- 468 Main St Unit 111
- 12 Spinnaker Dr
- 43 Village Crossing Unit 43
- 47 Village Crossing Unit 47
- 46 Village Crossing Unit 46
- 15 Griswold Rd
- 31 Regatta Dr
- 97 W Main St Unit 36
- 55 Corey Ln
- 185 Main St Unit 301
- 185 Main St Unit 305
- 43 Roxbury Ct
- 37 Stoneywood Dr
Your Personal Tour Guide
Ask me questions while you tour the home.