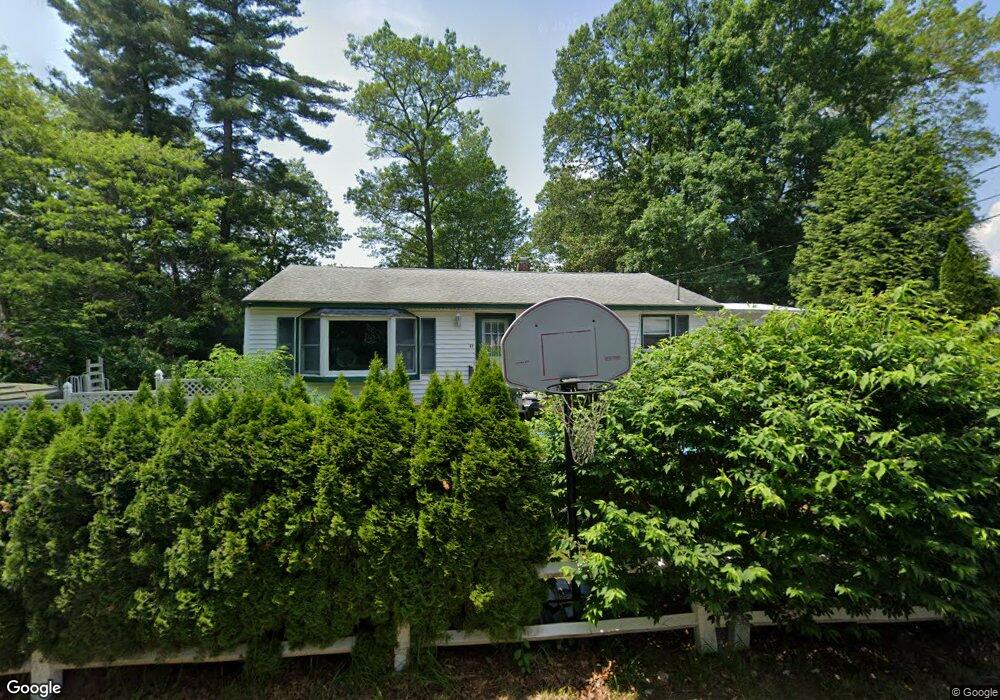
31 Barton Ave Dracut, MA 01826
Estimated Value: $434,000 - $531,000
3
Beds
1
Bath
1,120
Sq Ft
$445/Sq Ft
Est. Value
About This Home
This home is located at 31 Barton Ave, Dracut, MA 01826 and is currently estimated at $497,918, approximately $444 per square foot. 31 Barton Ave is a home located in Middlesex County with nearby schools including Brookside Elementary School, Richardson Middle School, and Dracut Senior High School.
Ownership History
Date
Name
Owned For
Owner Type
Purchase Details
Closed on
Nov 1, 2018
Sold by
Emond Rita L
Bought by
Hebert Timothy
Current Estimated Value
Home Financials for this Owner
Home Financials are based on the most recent Mortgage that was taken out on this home.
Original Mortgage
$300,366
Outstanding Balance
$263,026
Interest Rate
4.6%
Mortgage Type
FHA
Estimated Equity
$234,892
Purchase Details
Closed on
Jul 30, 1993
Sold by
Valcourt Armand and Valcourt Cecile
Bought by
Emond Rita L
Home Financials for this Owner
Home Financials are based on the most recent Mortgage that was taken out on this home.
Original Mortgage
$90,000
Interest Rate
7.32%
Mortgage Type
Purchase Money Mortgage
Create a Home Valuation Report for This Property
The Home Valuation Report is an in-depth analysis detailing your home's value as well as a comparison with similar homes in the area
Home Values in the Area
Average Home Value in this Area
Purchase History
| Date | Buyer | Sale Price | Title Company |
|---|---|---|---|
| Hebert Timothy | $306,000 | -- | |
| Emond Rita L | $100,000 | -- |
Source: Public Records
Mortgage History
| Date | Status | Borrower | Loan Amount |
|---|---|---|---|
| Open | Hebert Timothy | $300,366 | |
| Previous Owner | Emond Rita L | $17,977 | |
| Previous Owner | Emond Rita L | $90,000 |
Source: Public Records
Tax History
| Year | Tax Paid | Tax Assessment Tax Assessment Total Assessment is a certain percentage of the fair market value that is determined by local assessors to be the total taxable value of land and additions on the property. | Land | Improvement |
|---|---|---|---|---|
| 2025 | $4,571 | $451,700 | $194,100 | $257,600 |
| 2024 | $4,558 | $436,200 | $184,800 | $251,400 |
| 2023 | $4,366 | $377,000 | $160,700 | $216,300 |
| 2022 | $4,266 | $347,100 | $146,000 | $201,100 |
| 2021 | $17,475 | $316,500 | $132,800 | $183,700 |
| 2020 | $4,231 | $296,400 | $128,900 | $167,500 |
| 2019 | $7,572 | $261,700 | $122,700 | $139,000 |
| 2018 | $3,511 | $248,300 | $122,700 | $125,600 |
| 2017 | $3,409 | $235,100 | $122,700 | $112,400 |
| 2016 | $3,274 | $220,600 | $118,000 | $102,600 |
| 2015 | $3,179 | $212,900 | $118,000 | $94,900 |
| 2014 | $2,973 | $205,200 | $118,000 | $87,200 |
Source: Public Records
Map
Nearby Homes
- 17 Spare St
- 43 & 53 5th St
- 1905 Lakeview Ave
- 29 Mill St Unit B
- 13 Dallas Dr Unit 305
- 13 Dallas Dr Unit 107
- 124 Tennis Plaza Rd Unit 40
- 53 Vinal St
- 9 Cornstalk Ln
- 94 Tennis Plaza Rd Unit 10
- 74 Tennis Plaza Rd Unit 34
- 83 Turgeon Ave
- 9 Arbor Dr
- 1 Elm Grove Ave
- 154 New Boston Rd
- 91 Frederick St Unit 77
- 40 Westfall Rd
- 42 Frederick St Unit 9
- 104 Long Pond Rd
- 6 Wilshire Ln Unit 6
Your Personal Tour Guide
Ask me questions while you tour the home.