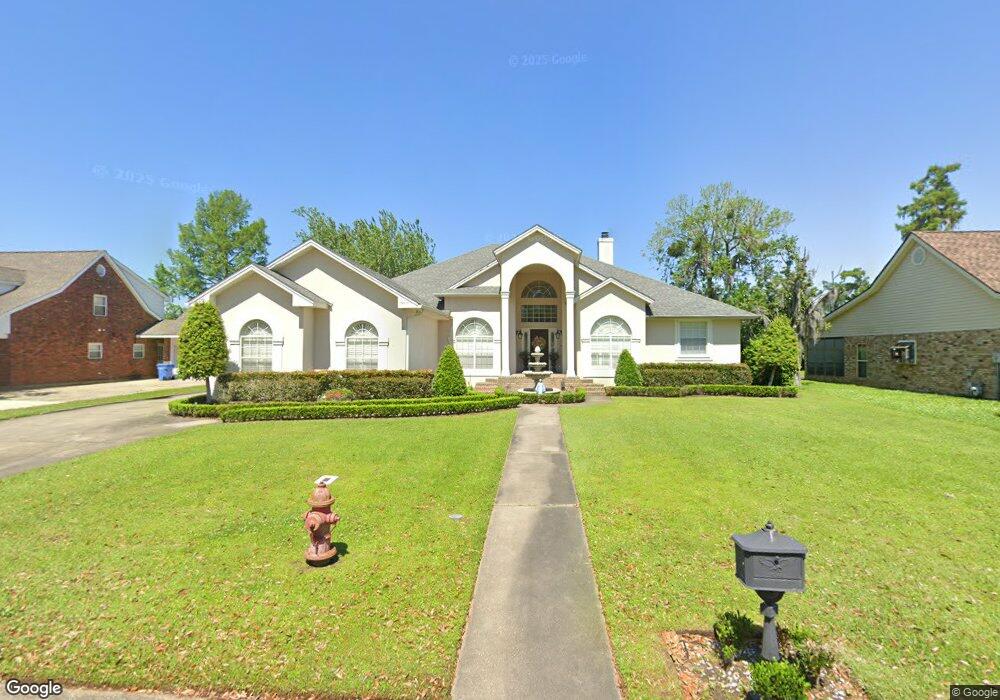
31 Belle Helene Dr Destrehan, LA 70047
Estimated Value: $517,000 - $575,000
4
Beds
3
Baths
3,496
Sq Ft
$159/Sq Ft
Est. Value
About This Home
This home is located at 31 Belle Helene Dr, Destrehan, LA 70047 and is currently estimated at $554,224, approximately $158 per square foot. 31 Belle Helene Dr is a home located in St. Charles Parish with nearby schools including New Sarpy Elementary School and St Charles Borromeo Elementary School.
Ownership History
Date
Name
Owned For
Owner Type
Purchase Details
Closed on
Jan 18, 2011
Sold by
Sadeghi Alirez and Soto Eliana Amparo
Bought by
Kuntz Kristy Chiro and Kuntz Matthew R
Current Estimated Value
Home Financials for this Owner
Home Financials are based on the most recent Mortgage that was taken out on this home.
Original Mortgage
$297,500
Outstanding Balance
$203,310
Interest Rate
4.83%
Mortgage Type
New Conventional
Estimated Equity
$350,914
Purchase Details
Closed on
Aug 17, 2007
Sold by
Smith Richard L and Smith Catherine Fitzsimmons
Bought by
Sadeghi Alireza
Home Financials for this Owner
Home Financials are based on the most recent Mortgage that was taken out on this home.
Original Mortgage
$81,000
Interest Rate
6.72%
Mortgage Type
New Conventional
Create a Home Valuation Report for This Property
The Home Valuation Report is an in-depth analysis detailing your home's value as well as a comparison with similar homes in the area
Home Values in the Area
Average Home Value in this Area
Purchase History
| Date | Buyer | Sale Price | Title Company |
|---|---|---|---|
| Kuntz Kristy Chiro | $377,500 | Crescent Title Llc | |
| Sadeghi Alireza | $405,000 | Republic Land Title Co |
Source: Public Records
Mortgage History
| Date | Status | Borrower | Loan Amount |
|---|---|---|---|
| Open | Kuntz Kristy Chiro | $297,500 | |
| Previous Owner | Sadeghi Alireza | $81,000 | |
| Previous Owner | Sadeghi Alireza | $324,000 |
Source: Public Records
Tax History Compared to Growth
Tax History
| Year | Tax Paid | Tax Assessment Tax Assessment Total Assessment is a certain percentage of the fair market value that is determined by local assessors to be the total taxable value of land and additions on the property. | Land | Improvement |
|---|---|---|---|---|
| 2024 | $3,996 | $46,520 | $15,410 | $31,110 |
| 2023 | $3,996 | $35,330 | $8,570 | $26,760 |
| 2022 | $4,119 | $35,330 | $8,570 | $26,760 |
| 2021 | $3,739 | $31,797 | $7,713 | $24,084 |
| 2020 | $4,151 | $35,330 | $8,570 | $26,760 |
| 2019 | $4,133 | $34,957 | $7,851 | $27,106 |
| 2018 | $4,101 | $34,957 | $7,851 | $27,106 |
| 2017 | $4,101 | $34,957 | $7,851 | $27,106 |
| 2016 | $4,118 | $34,957 | $7,851 | $27,106 |
| 2015 | $3,219 | $34,957 | $6,201 | $28,756 |
| 2014 | $3,099 | $34,957 | $6,201 | $28,756 |
| 2013 | $3,110 | $34,957 | $6,201 | $28,756 |
Source: Public Records
Map
Nearby Homes
- 29 Belle Helene Dr
- 33 Belle Helene Dr
- 0 Belle Helene Dr
- 948 Belle Helene Dr
- 32 Bellgrove Dr
- 32 Belle Grove Dr
- 34 Bellgrove Dr
- 34 Bellgrove Dr
- 34 Belle Grove Dr
- 35 Belle Helene Dr
- 27 Belle Helene Dr
- 30 Bellgrove Dr
- 28 Belle Grove Dr
- 30 Belle Grove Dr
- 50 Belle Helene Dr
- 28 Bellgrove Dr
- 36 Bellgrove Dr
- 52 Belle Helene Dr
- 26 Belle Grove Dr
- 37 Belle Helene Dr