Estimated Value: $183,000 - $248,410
--
Bed
--
Bath
1,582
Sq Ft
$138/Sq Ft
Est. Value
About This Home
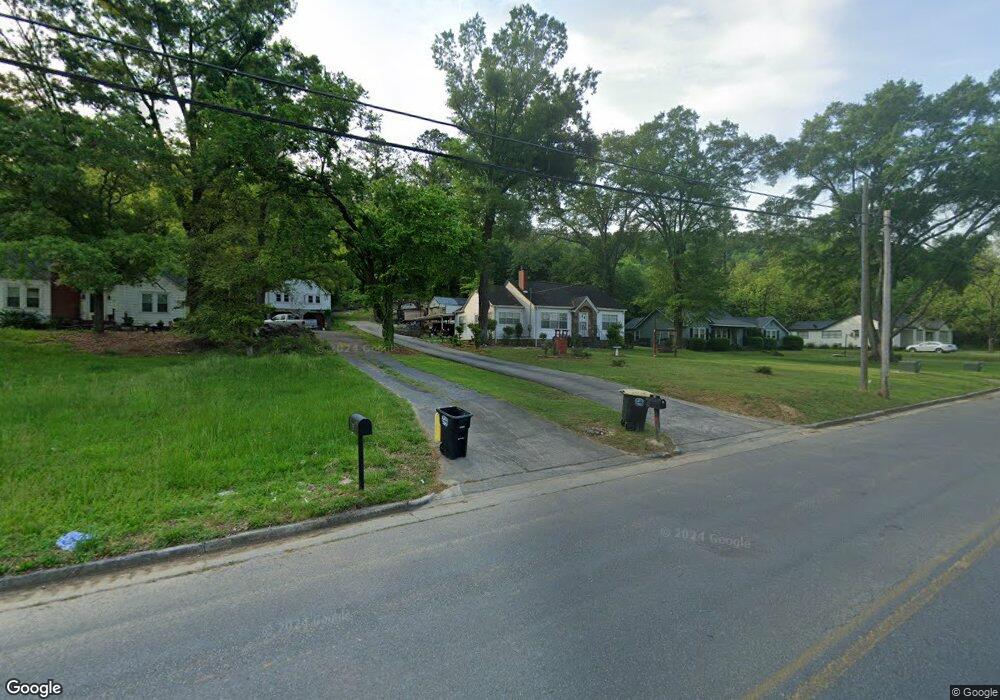
This home is located at 31 Blacks Bluff Rd SW, Rome, GA 30161 and is currently estimated at $218,853, approximately $138 per square foot. 31 Blacks Bluff Rd SW is a home located in Floyd County with nearby schools including Dan McCarty Middle School, Rome High School, and Darlington School.
Ownership History
Date
Name
Owned For
Owner Type
Purchase Details
Closed on
Jan 6, 2020
Sold by
Lewis Rob
Bought by
Lewis Larry and Lewis Toni
Current Estimated Value
Purchase Details
Closed on
Jul 17, 2019
Sold by
Pereira Leonel
Bought by
Lewis Rob
Purchase Details
Closed on
Sep 15, 2015
Sold by
United Community Bank
Bought by
Pereira Leonel and Pereira Luisa
Purchase Details
Closed on
Aug 5, 2014
Sold by
Hou Dongye
Bought by
United Community Bank
Purchase Details
Closed on
Feb 12, 2002
Sold by
Secretary Of Housing And Urban Developme
Bought by
Hou Dongye A and Hou K
Purchase Details
Closed on
Aug 7, 2001
Bought by
P and R
Purchase Details
Closed on
Jul 31, 1997
Sold by
Cole Agetha Ann and Phyllis Elaine Whitley
Bought by
Smith Kevin D
Purchase Details
Closed on
Aug 3, 1993
Sold by
Graham R L
Bought by
Cole Agetha Ann and Phyllis Elaine Wh
Purchase Details
Closed on
Jan 1, 1901
Bought by
Graham R L
Create a Home Valuation Report for This Property
The Home Valuation Report is an in-depth analysis detailing your home's value as well as a comparison with similar homes in the area
Home Values in the Area
Average Home Value in this Area
Purchase History
| Date | Buyer | Sale Price | Title Company |
|---|---|---|---|
| Lewis Larry | -- | -- | |
| Lewis Rob | $109,900 | -- | |
| Pereira Leonel | $27,000 | -- | |
| United Community Bank | $50,411 | -- | |
| Hou Dongye A | -- | -- | |
| P | $88,200 | -- | |
| Secretary Of Housing And Urban Developme | $97,700 | -- | |
| Homeside Lending Inc | $97,700 | -- | |
| Smith Kevin D | $80,900 | -- | |
| Smith Kevin D | -- | -- | |
| Cole Agetha Ann | -- | -- | |
| Graham R L | -- | -- |
Source: Public Records
Tax History Compared to Growth
Tax History
| Year | Tax Paid | Tax Assessment Tax Assessment Total Assessment is a certain percentage of the fair market value that is determined by local assessors to be the total taxable value of land and additions on the property. | Land | Improvement |
|---|---|---|---|---|
| 2024 | $2,733 | $69,514 | $21,392 | $48,122 |
| 2023 | $2,462 | $65,721 | $19,447 | $46,274 |
| 2022 | $1,921 | $52,657 | $16,105 | $36,552 |
| 2021 | $1,724 | $46,468 | $14,785 | $31,683 |
| 2020 | $1,570 | $42,693 | $12,857 | $29,836 |
| 2019 | $1,336 | $36,085 | $12,857 | $23,228 |
| 2018 | $1,258 | $33,976 | $12,247 | $21,729 |
| 2017 | $1,191 | $32,157 | $11,340 | $20,817 |
| 2016 | $383 | $31,680 | $11,320 | $20,360 |
| 2015 | -- | $31,680 | $11,320 | $20,360 |
| 2014 | -- | $31,680 | $11,320 | $20,360 |
Source: Public Records
Map
Nearby Homes
- 25 Blacks Bluff Rd SW
- 11 Blacks Bluff Rd SW
- 2055 Blacks Bluff Rd SW
- 3 Porter St SW
- 529 Branham Ave SW
- 316 S McLin St SW
- 515 Hardy Ave SW
- 5 Jervis St SW
- 13 N Blanche Ave SW
- 3 Grover St SW
- 44 Marvin Crowe Dr SW
- 515 Harper Ave SW
- 410 Hardy Ave SW
- 111 Lookout Cir SW
- 107 Butler St SW
- 113 Lookout Cir SW
- 115 Lookout Cir SW
- 7 Pine Valley Rd SW
- 515 S Broad St SW
- 31 Blacks Bluff Rd SW
- 27 Blacks Bluff Rd SW
- 33 Blacks Bluff Rd SW
- 23 Blacks Bluff Rd SW
- 35 Blacks Bluff Rd SW
- 26 Blacks Bluff Rd SW
- 30 Blacks Bluff Rd SW
- 24 Blacks Bluff Rd SW
- 34 Blacks Bluff Rd SW
- 34 Blacks Bluff Rd SW
- 21 Blacks Bluff Rd SW
- 37 Blacks Bluff Rd SW
- 22 Blacks Bluff Rd SW
- 36 Blacks Bluff Rd SW
- 19 Blacks Bluff Rd SW
- 18 Blacks Bluff Rd SW
- 38 Blacks Bluff Rd SW
- 16 Blacks Bluff Rd SW
- 17 Blacks Bluff Rd SW
- 17 Blacks Bluff Rd SW