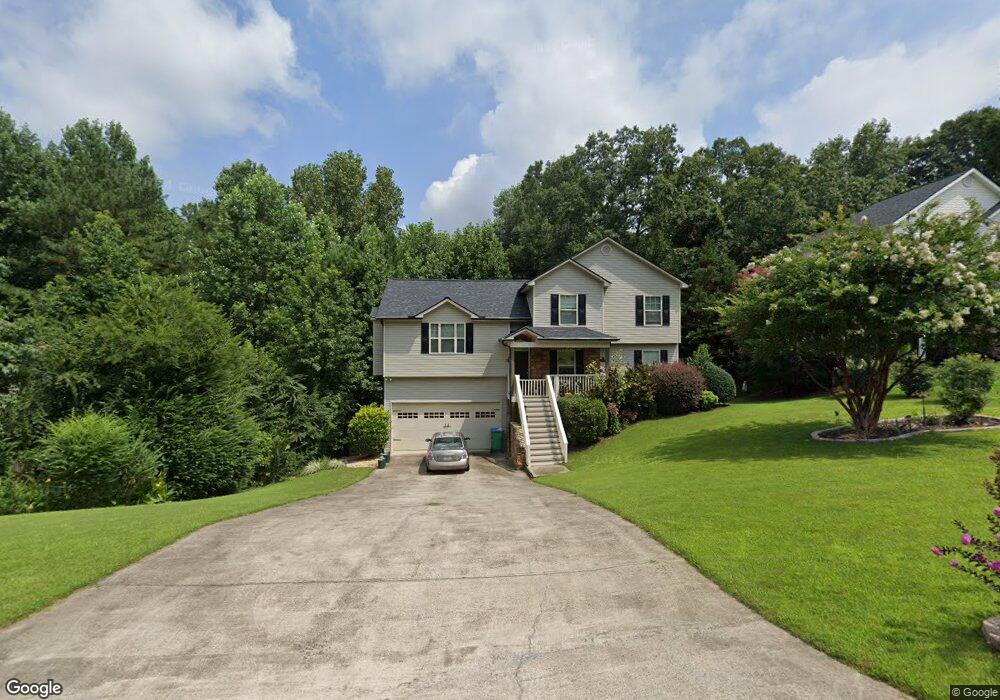
31 Blakes Ln Unit 49 Talking Rock, GA 30175
Estimated Value: $382,000 - $413,000
4
Beds
3
Baths
2,049
Sq Ft
$194/Sq Ft
Est. Value
About This Home
This home is located at 31 Blakes Ln Unit 49, Talking Rock, GA 30175 and is currently estimated at $397,585, approximately $194 per square foot. 31 Blakes Ln Unit 49 is a home located in Pickens County with nearby schools including Hill City Elementary School, Pickens County Middle School, and Pickens County High School.
Ownership History
Date
Name
Owned For
Owner Type
Purchase Details
Closed on
Jul 2, 2019
Sold by
Dobson Properties Inc
Bought by
Geiger Tina L
Current Estimated Value
Home Financials for this Owner
Home Financials are based on the most recent Mortgage that was taken out on this home.
Original Mortgage
$173,600
Outstanding Balance
$150,776
Interest Rate
3.82%
Mortgage Type
New Conventional
Estimated Equity
$246,809
Purchase Details
Closed on
May 14, 2013
Sold by
Secretary Of Housing & Urban Development
Bought by
Dobson Properties Inc
Purchase Details
Closed on
Sep 4, 2012
Sold by
Bank Of America Na
Bought by
Secretary Of Housing & Urban Development
Purchase Details
Closed on
Nov 30, 2009
Sold by
Secretary Of Housing & Urban D
Bought by
Gudger John Robert
Home Financials for this Owner
Home Financials are based on the most recent Mortgage that was taken out on this home.
Original Mortgage
$135,978
Interest Rate
5.01%
Mortgage Type
FHA
Purchase Details
Closed on
May 5, 2009
Sold by
Wells Fargo Bank Na
Bought by
Secretary Of Housing & Urban Development
Purchase Details
Closed on
Apr 25, 2007
Sold by
North Metro Developments L
Bought by
Lacy Michael C
Home Financials for this Owner
Home Financials are based on the most recent Mortgage that was taken out on this home.
Original Mortgage
$187,064
Interest Rate
6.11%
Mortgage Type
New Conventional
Purchase Details
Closed on
Oct 18, 2006
Sold by
Willow Creek Of Pickens Llc
Bought by
North Metro Developments Inc
Purchase Details
Closed on
Jan 27, 2004
Sold by
Lacy Michael C
Bought by
Willow Creek Of Pickens Llc
Create a Home Valuation Report for This Property
The Home Valuation Report is an in-depth analysis detailing your home's value as well as a comparison with similar homes in the area
Home Values in the Area
Average Home Value in this Area
Purchase History
| Date | Buyer | Sale Price | Title Company |
|---|---|---|---|
| Geiger Tina L | $217,000 | -- | |
| Dobson Properties Inc | -- | -- | |
| Dobson Properties Inc | $108,440 | -- | |
| Secretary Of Housing & Urban Development | -- | -- | |
| Sec Of Housing & Urban | $152,543 | -- | |
| Bank Of America | $152,543 | -- | |
| Gudger John Robert | -- | -- | |
| Secretary Of Housing & Urban Development | -- | -- | |
| Lacy Michael C | $190,000 | -- | |
| North Metro Developments Inc | $39,000 | -- | |
| Willow Creek Of Pickens Llc | -- | -- |
Source: Public Records
Mortgage History
| Date | Status | Borrower | Loan Amount |
|---|---|---|---|
| Open | Geiger Tina L | $173,600 | |
| Previous Owner | Gudger John Robert | $135,978 | |
| Previous Owner | Lacy Michael C | $187,064 |
Source: Public Records
Tax History
| Year | Tax Paid | Tax Assessment Tax Assessment Total Assessment is a certain percentage of the fair market value that is determined by local assessors to be the total taxable value of land and additions on the property. | Land | Improvement |
|---|---|---|---|---|
| 2025 | $2,216 | $158,474 | $16,000 | $142,474 |
| 2024 | $2,421 | $127,350 | $16,000 | $111,350 |
| 2023 | $2,488 | $127,350 | $16,000 | $111,350 |
| 2022 | $1,647 | $85,958 | $10,000 | $75,958 |
| 2021 | $1,764 | $85,958 | $10,000 | $75,958 |
| 2020 | $1,817 | $85,958 | $10,000 | $75,958 |
| 2019 | $1,705 | $74,272 | $10,000 | $64,272 |
| 2018 | $1,721 | $74,272 | $10,000 | $64,272 |
| 2017 | $1,226 | $52,069 | $10,000 | $42,069 |
| 2016 | $1,246 | $52,069 | $10,000 | $42,069 |
| 2015 | $1,217 | $52,069 | $10,000 | $42,069 |
| 2014 | $1,219 | $52,069 | $10,000 | $42,069 |
| 2013 | -- | $52,069 | $10,000 | $42,069 |
Source: Public Records
Map
Nearby Homes
- 69 Blakes Ln
- 0 Swan Bridge Rd Unit 7701634
- 0 Swan Bridge Rd Unit 10670001
- 629 Georgia 136 Connector
- 7407 Highway 136 W
- 629 Highway 136 Connector
- 200 Willow Ln
- 1398 Antioch Church Rd
- 0 Antioch Church Rd Unit 10568521
- 0 Antioch Church Rd Unit 10567916
- 0 Antioch Church Rd Unit 7619044
- 966 Antioch Church Rd
- Lot 2 Swan Bridge Rd
- 01 Swan Bridge Rd
- 701 Tatum Rd
- 874 Town Creek Church Rd
- 6414 Highway 136 W
- 0 Highway 136 W
- 11 Bradley Rd
- 0 Crayfish Place Unit 7681507
Your Personal Tour Guide
Ask me questions while you tour the home.