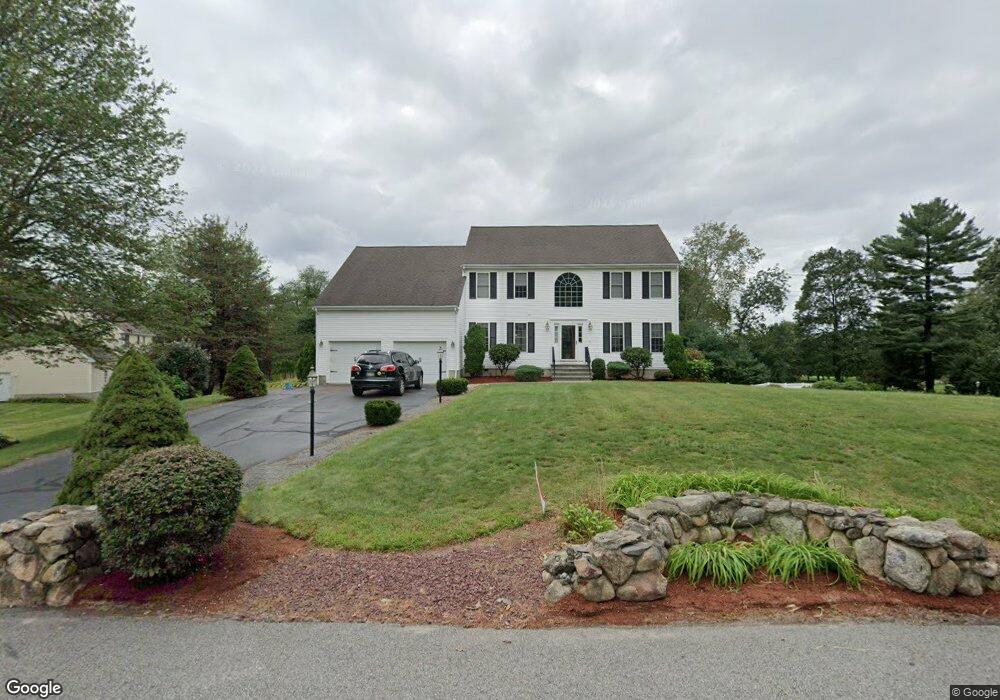
31 Bow St Plainville, MA 02762
Estimated Value: $815,960 - $1,063,000
4
Beds
3
Baths
2,808
Sq Ft
$321/Sq Ft
Est. Value
About This Home
This home is located at 31 Bow St, Plainville, MA 02762 and is currently estimated at $901,740, approximately $321 per square foot. 31 Bow St is a home located in Norfolk County with nearby schools including Anna Ware Jackson School, Beatrice H. Wood Elementary School, and Mercymount Country Day School.
Ownership History
Date
Name
Owned For
Owner Type
Purchase Details
Closed on
Feb 27, 2021
Sold by
Pereira William T and Pereira Carla E
Bought by
Pereira
Current Estimated Value
Purchase Details
Closed on
Dec 13, 1999
Sold by
Worldwide Dev Corp
Bought by
Pereira William T and Pereira Carla E
Home Financials for this Owner
Home Financials are based on the most recent Mortgage that was taken out on this home.
Original Mortgage
$281,000
Interest Rate
7.9%
Mortgage Type
Purchase Money Mortgage
Create a Home Valuation Report for This Property
The Home Valuation Report is an in-depth analysis detailing your home's value as well as a comparison with similar homes in the area
Home Values in the Area
Average Home Value in this Area
Purchase History
| Date | Buyer | Sale Price | Title Company |
|---|---|---|---|
| Pereira | -- | None Available | |
| Pereira William T | $352,200 | -- |
Source: Public Records
Mortgage History
| Date | Status | Borrower | Loan Amount |
|---|---|---|---|
| Previous Owner | Pereira William T | $281,000 |
Source: Public Records
Tax History
| Year | Tax Paid | Tax Assessment Tax Assessment Total Assessment is a certain percentage of the fair market value that is determined by local assessors to be the total taxable value of land and additions on the property. | Land | Improvement |
|---|---|---|---|---|
| 2025 | $87 | $749,100 | $246,800 | $502,300 |
| 2024 | $8,152 | $679,300 | $224,900 | $454,400 |
| 2023 | $7,946 | $636,700 | $224,900 | $411,800 |
| 2022 | $7,851 | $559,600 | $216,800 | $342,800 |
| 2021 | $7,629 | $519,000 | $216,800 | $302,200 |
| 2020 | $7,429 | $505,400 | $216,800 | $288,600 |
| 2019 | $7,621 | $509,100 | $206,800 | $302,300 |
Source: Public Records
Map
Nearby Homes
Your Personal Tour Guide
Ask me questions while you tour the home.