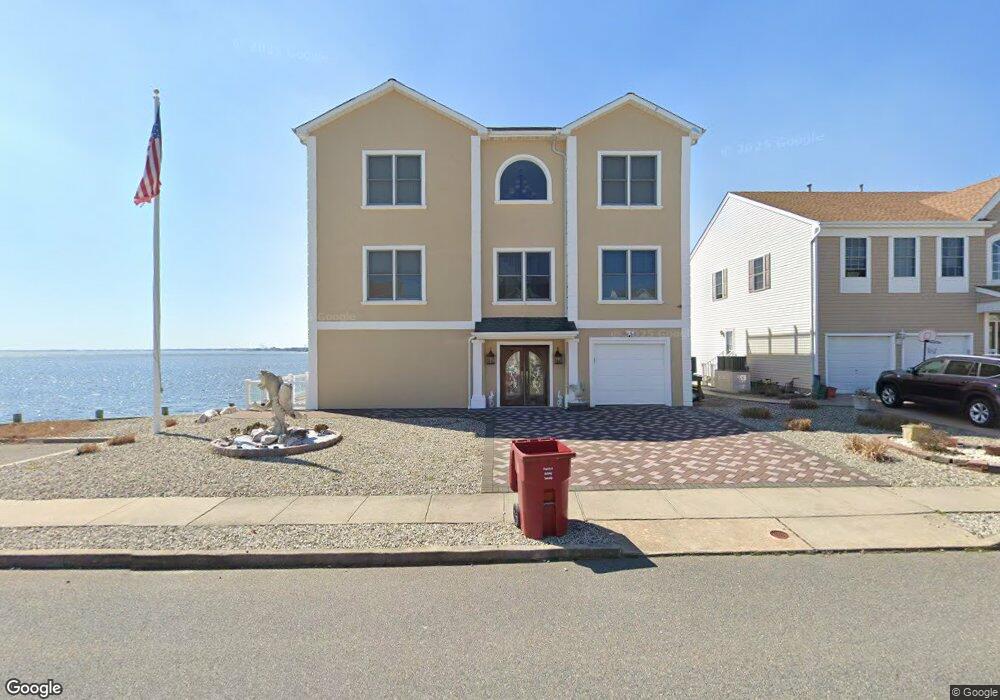
31 Bowsprit Dr Berkeley Township, NJ 08721
Estimated Value: $946,000 - $1,056,744
4
Beds
4
Baths
2,172
Sq Ft
$462/Sq Ft
Est. Value
About This Home
This home is located at 31 Bowsprit Dr, Berkeley Township, NJ 08721 and is currently estimated at $1,003,936, approximately $462 per square foot. 31 Bowsprit Dr is a home located in Ocean County with nearby schools including Central Regional Middle School, Central Regional High School, and Ocean Academy.
Ownership History
Date
Name
Owned For
Owner Type
Purchase Details
Closed on
Jun 18, 2021
Sold by
Huang Ken and Huang Janet
Bought by
Cunha Eduardo H and Belo Eliana
Current Estimated Value
Home Financials for this Owner
Home Financials are based on the most recent Mortgage that was taken out on this home.
Original Mortgage
$520,000
Outstanding Balance
$470,795
Interest Rate
2.9%
Mortgage Type
New Conventional
Estimated Equity
$533,141
Purchase Details
Closed on
Aug 17, 2009
Sold by
Spalliero Mario and Spalliero Maria
Bought by
Huang Ken and Huang Janet
Home Financials for this Owner
Home Financials are based on the most recent Mortgage that was taken out on this home.
Original Mortgage
$300,000
Interest Rate
5%
Mortgage Type
Seller Take Back
Purchase Details
Closed on
Nov 16, 2001
Sold by
K Hovnanian At Berkeley
Bought by
Spalliero Mario and Spalliero Maria
Create a Home Valuation Report for This Property
The Home Valuation Report is an in-depth analysis detailing your home's value as well as a comparison with similar homes in the area
Home Values in the Area
Average Home Value in this Area
Purchase History
| Date | Buyer | Sale Price | Title Company |
|---|---|---|---|
| Cunha Eduardo H | $650,000 | Attorney Title Services Llc | |
| Cunha Eduardo H | $650,000 | Chicago Title | |
| Huang Ken | $750,000 | New Jersey Title Ins Company | |
| Spalliero Mario | $125,000 | -- |
Source: Public Records
Mortgage History
| Date | Status | Borrower | Loan Amount |
|---|---|---|---|
| Open | Cunha Eduardo H | $520,000 | |
| Closed | Cunha Eduardo H | $520,000 | |
| Previous Owner | Huang Ken | $300,000 |
Source: Public Records
Tax History Compared to Growth
Tax History
| Year | Tax Paid | Tax Assessment Tax Assessment Total Assessment is a certain percentage of the fair market value that is determined by local assessors to be the total taxable value of land and additions on the property. | Land | Improvement |
|---|---|---|---|---|
| 2025 | $17,482 | $725,100 | $410,000 | $315,100 |
| 2024 | $16,822 | $725,100 | $410,000 | $315,100 |
| 2023 | $16,511 | $725,100 | $410,000 | $315,100 |
| 2022 | $16,511 | $725,100 | $410,000 | $315,100 |
| 2021 | $16,162 | $725,100 | $410,000 | $315,100 |
| 2020 | $16,162 | $725,100 | $410,000 | $315,100 |
| 2019 | $15,713 | $725,100 | $410,000 | $315,100 |
| 2018 | $15,662 | $725,100 | $410,000 | $315,100 |
| 2017 | $15,082 | $725,100 | $410,000 | $315,100 |
| 2016 | $15,002 | $725,100 | $410,000 | $315,100 |
| 2015 | $14,589 | $725,100 | $410,000 | $315,100 |
| 2014 | $14,176 | $725,100 | $410,000 | $315,100 |
Source: Public Records
Map
Nearby Homes
- 8 Jibsail Dr
- 46 Amherst Dr
- 11 Drake Dr
- 7 Travelers Way
- 73 Carlyle Dr
- 32 Toppinglift Dr
- 76 Ronald Ave S
- 33 Blue Heron Ln
- 13 Skimmer Ln Unit 48
- 66 Wind Jammer Ct
- 530 E Point Pleasant Ave
- 723 E Long Branch Ave
- 334 E Cape May Ave
- 82 Spinnaker Ct
- 12 E Longport Ave
- 54 Storm Jib Ct
- 416 Monmouth Ave
- Elm&Cherry Cherry St
- 241 E Lakewood Ave
- 1011 Balsam Dr