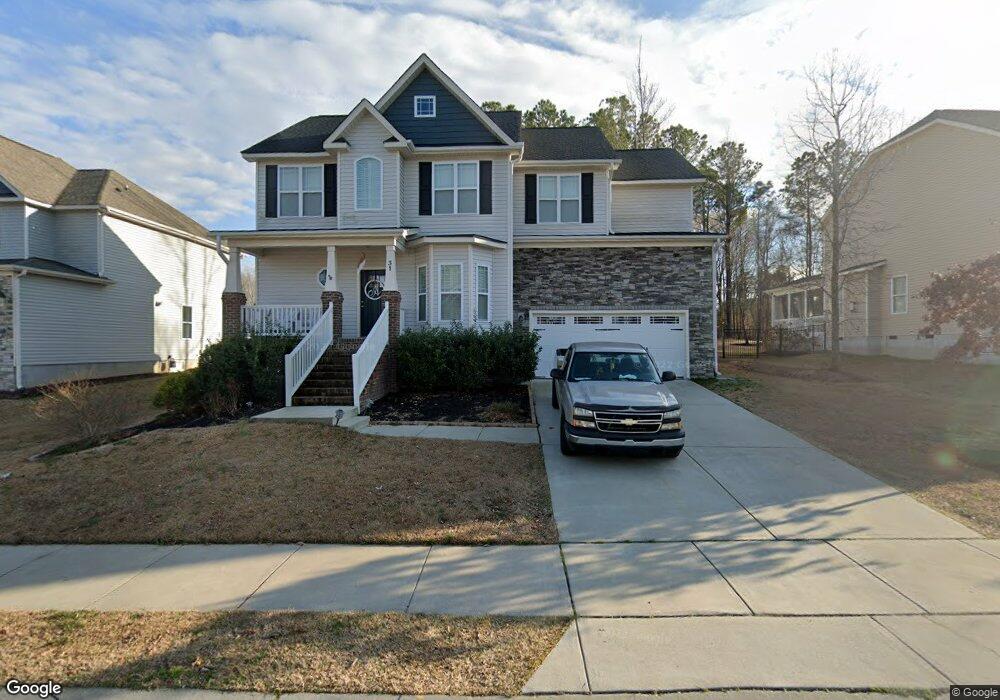
31 Brandywine Way Unit 6 Clayton, NC 27527
Estimated Value: $391,000 - $426,000
4
Beds
3
Baths
2,029
Sq Ft
$202/Sq Ft
Est. Value
About This Home
This home is located at 31 Brandywine Way Unit 6, Clayton, NC 27527 and is currently estimated at $408,970, approximately $201 per square foot. 31 Brandywine Way Unit 6 is a home located in Johnston County with nearby schools including Powhatan Elementary School, Riverwood Middle School, and Clayton High.
Ownership History
Date
Name
Owned For
Owner Type
Purchase Details
Closed on
May 16, 2019
Sold by
Troxell Christopher Adam and Troxell Julia Elizabeth
Bought by
Serrano Noelia Michelle and Arango Daniel
Current Estimated Value
Home Financials for this Owner
Home Financials are based on the most recent Mortgage that was taken out on this home.
Original Mortgage
$255,290
Outstanding Balance
$226,315
Interest Rate
4.62%
Mortgage Type
FHA
Estimated Equity
$182,655
Purchase Details
Closed on
Sep 6, 2016
Sold by
Wynn Construction Inc
Bought by
Troxell Christopher Adam and Troxell Julia Elizabeth
Home Financials for this Owner
Home Financials are based on the most recent Mortgage that was taken out on this home.
Original Mortgage
$164,900
Interest Rate
3.43%
Mortgage Type
VA
Purchase Details
Closed on
Apr 14, 2016
Sold by
Neal William R O
Bought by
Wynn Construction Inc
Create a Home Valuation Report for This Property
The Home Valuation Report is an in-depth analysis detailing your home's value as well as a comparison with similar homes in the area
Home Values in the Area
Average Home Value in this Area
Purchase History
| Date | Buyer | Sale Price | Title Company |
|---|---|---|---|
| Serrano Noelia Michelle | $260,000 | None Available | |
| Troxell Christopher Adam | $240,000 | None Available | |
| Wynn Construction Inc | $180,000 | None Available |
Source: Public Records
Mortgage History
| Date | Status | Borrower | Loan Amount |
|---|---|---|---|
| Open | Serrano Noelia Michelle | $255,290 | |
| Previous Owner | Troxell Christopher Adam | $164,900 |
Source: Public Records
Tax History Compared to Growth
Tax History
| Year | Tax Paid | Tax Assessment Tax Assessment Total Assessment is a certain percentage of the fair market value that is determined by local assessors to be the total taxable value of land and additions on the property. | Land | Improvement |
|---|---|---|---|---|
| 2025 | $3,852 | $381,380 | $70,000 | $311,380 |
| 2024 | $3,354 | $254,070 | $52,000 | $202,070 |
| 2023 | $3,278 | $254,070 | $52,000 | $202,070 |
| 2022 | $3,379 | $254,070 | $52,000 | $202,070 |
| 2021 | $3,328 | $254,070 | $52,000 | $202,070 |
| 2020 | $3,405 | $254,070 | $52,000 | $202,070 |
| 2019 | $3,405 | $254,070 | $52,000 | $202,070 |
| 2018 | $3,067 | $225,520 | $40,000 | $185,520 |
| 2017 | $2,999 | $225,520 | $40,000 | $185,520 |
| 2016 | $532 | $40,000 | $40,000 | $0 |
Source: Public Records
Map
Nearby Homes
- 221 Parkridge Dr
- 104 Avenel Ln
- 116 Townsend Dr
- 902 Birkdale Dr
- 23 Lafoy Dr
- 204 Colonial Dr
- 152 Antler Steel Dr
- 47 Whitley Ridge Dr
- 821 Glen Laurel Rd
- 205 Townsend Dr
- 217 N Skymont Dr
- 3226 Powhatan Rd
- 114 Sugarbush Ct
- 175 Cherry Bark Loop
- 3305 Wisteria Dr
- 117 Lake Point Dr
- 19 Onslow Dr
- 3460 Powhatan Rd
- 222 S Stonehaven Way
- 111 Innsbruck Dr
- 31 Brandywine Way
- 51 Brandywine Way Unit 7
- 51 Brandywine Way
- 15 Brandywine Way Unit 5
- 15 Brandywine Way
- 175 Hawkesburg Dr
- 69 Brandywine Way Unit 8
- 69 Brandywine Way
- 28 Brandywine Way
- 157 Hawkesburg Dr
- 46 Brandywine Way Unit 12
- 46 Brandywine Way
- 12 Brandywine Way Unit 14
- 200 Hawkesburg Dr Unit 45
- 184 Hawkesburg Dr Unit 46
- 81 Brandywine Way
- 214 Hawkesburg Dr Unit 44
- 168 Hawkesburg Dr Unit 47
- 168 Hawkesburg Dr
- 135 Hawkesburg Dr Unit 2