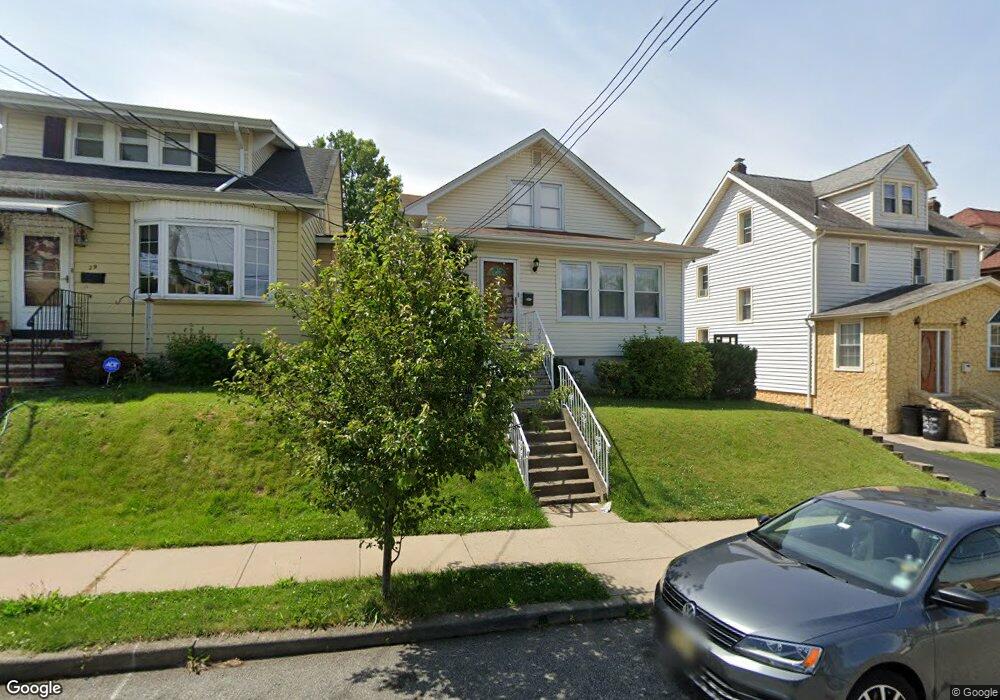
31 Burgh Ave Clifton, NJ 07011
Middle Village NeighborhoodEstimated Value: $579,485 - $755,000
Studio
--
Bath
1,710
Sq Ft
$383/Sq Ft
Est. Value
About This Home
This home is located at 31 Burgh Ave, Clifton, NJ 07011 and is currently estimated at $654,371, approximately $382 per square foot. 31 Burgh Ave is a home located in Passaic County with nearby schools including Clifton High School, Classical Academy Charter School of Clifton, and Bright Start Academy.
Ownership History
Date
Name
Owned For
Owner Type
Purchase Details
Closed on
Feb 14, 2006
Sold by
Alahakone Senadhi
Bought by
Abella Adrian L
Current Estimated Value
Home Financials for this Owner
Home Financials are based on the most recent Mortgage that was taken out on this home.
Original Mortgage
$344,000
Outstanding Balance
$201,256
Interest Rate
6.87%
Mortgage Type
Adjustable Rate Mortgage/ARM
Estimated Equity
$453,115
Purchase Details
Closed on
Nov 17, 1997
Sold by
Stamato Anthony and Stamato Louis
Bought by
Alahakone Senadhi
Home Financials for this Owner
Home Financials are based on the most recent Mortgage that was taken out on this home.
Original Mortgage
$123,500
Interest Rate
7.17%
Purchase Details
Closed on
Oct 28, 1997
Sold by
Stamato Carmela Lomauro and Lomauro Rosario F
Bought by
Stamato Anthony
Home Financials for this Owner
Home Financials are based on the most recent Mortgage that was taken out on this home.
Original Mortgage
$123,500
Interest Rate
7.17%
Create a Home Valuation Report for This Property
The Home Valuation Report is an in-depth analysis detailing your home's value as well as a comparison with similar homes in the area
Home Values in the Area
Average Home Value in this Area
Purchase History
| Date | Buyer | Sale Price | Title Company |
|---|---|---|---|
| Abella Adrian L | $430,000 | -- | |
| Alahakone Senadhi | $130,000 | -- | |
| Stamato Anthony | -- | -- |
Source: Public Records
Mortgage History
| Date | Status | Borrower | Loan Amount |
|---|---|---|---|
| Open | Abella Adrian L | $344,000 | |
| Previous Owner | Alahakone Senadhi | $123,500 |
Source: Public Records
Tax History
| Year | Tax Paid | Tax Assessment Tax Assessment Total Assessment is a certain percentage of the fair market value that is determined by local assessors to be the total taxable value of land and additions on the property. | Land | Improvement |
|---|---|---|---|---|
| 2025 | $9,925 | $167,200 | $75,900 | $91,300 |
| 2024 | $9,438 | $167,200 | $75,900 | $91,300 |
| 2022 | $9,547 | $167,200 | $75,900 | $91,300 |
| 2021 | $9,154 | $167,200 | $75,900 | $91,300 |
| 2020 | $9,184 | $167,200 | $75,900 | $91,300 |
| 2019 | $9,119 | $167,200 | $75,900 | $91,300 |
| 2018 | $9,067 | $167,200 | $75,900 | $91,300 |
| 2017 | $8,969 | $167,200 | $75,900 | $91,300 |
| 2016 | $8,545 | $167,200 | $75,900 | $91,300 |
| 2015 | $8,459 | $167,200 | $75,900 | $91,300 |
| 2014 | $8,281 | $167,200 | $75,900 | $91,300 |
Source: Public Records
Map
Nearby Homes
- 35 Franklin Ave
- 301 3rd St
- 25 Caroline Ave
- 65 Madison Ave
- 31 Demott Ave
- 157 van Riper Ave
- 10 Grace Ave
- 517 Clifton Ave
- 157 Demott Ave
- 246 Harding Ave
- 134 Knapp Ave
- 147 Clinton Ave
- 87 Merselis Ave
- 17 Viola Ave
- 16 Loretta St
- 169 E 6th St
- 9 van Cleve Ave
- 122 Sheridan Ave
- 130 E 7th St
- 1001 Unicorn Way Unit D-1
Your Personal Tour Guide
Ask me questions while you tour the home.