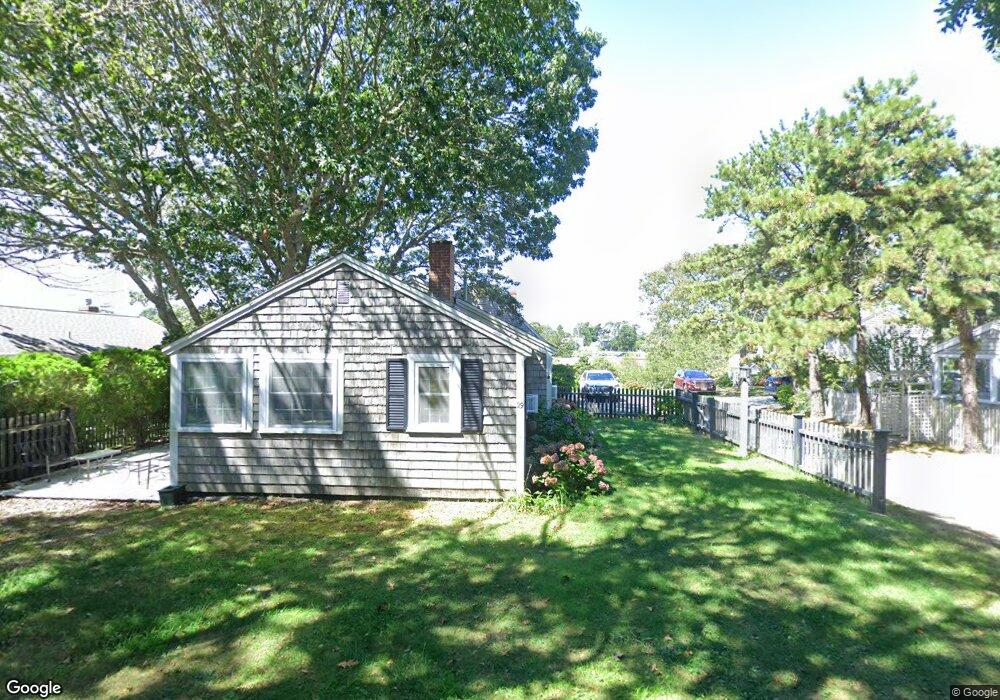
31 Caleb St Dennis Port, MA 2639
Dennis Port NeighborhoodEstimated Value: $663,000 - $787,000
2
Beds
2
Baths
1,500
Sq Ft
$486/Sq Ft
Est. Value
About This Home
This home is located at 31 Caleb St, Dennis Port, MA 2639 and is currently estimated at $729,217, approximately $486 per square foot. 31 Caleb St is a home located in Barnstable County with nearby schools including Dennis-Yarmouth Regional High School and St. Pius X. School.
Ownership History
Date
Name
Owned For
Owner Type
Purchase Details
Closed on
Jan 6, 2006
Sold by
Derosa Joseph A and Derosa Maryann
Bought by
Ekey Diane K and Ekey Glenn W
Current Estimated Value
Home Financials for this Owner
Home Financials are based on the most recent Mortgage that was taken out on this home.
Original Mortgage
$360,000
Interest Rate
6.28%
Mortgage Type
Purchase Money Mortgage
Purchase Details
Closed on
Nov 22, 2000
Sold by
Nouri Esmat and Nouri Marilyn
Bought by
Derosa Joseph A and Derosa Maryann
Home Financials for this Owner
Home Financials are based on the most recent Mortgage that was taken out on this home.
Original Mortgage
$174,900
Interest Rate
7.78%
Mortgage Type
Purchase Money Mortgage
Create a Home Valuation Report for This Property
The Home Valuation Report is an in-depth analysis detailing your home's value as well as a comparison with similar homes in the area
Home Values in the Area
Average Home Value in this Area
Purchase History
| Date | Buyer | Sale Price | Title Company |
|---|---|---|---|
| Ekey Diane K | $450,000 | -- | |
| Derosa Joseph A | $249,900 | -- | |
| Ekey Diane K | $450,000 | -- | |
| Derosa Joseph A | $249,900 | -- |
Source: Public Records
Mortgage History
| Date | Status | Borrower | Loan Amount |
|---|---|---|---|
| Open | Derosa Joseph A | $280,000 | |
| Closed | Ekey Diane K | $360,000 | |
| Previous Owner | Derosa Joseph A | $174,900 |
Source: Public Records
Tax History Compared to Growth
Tax History
| Year | Tax Paid | Tax Assessment Tax Assessment Total Assessment is a certain percentage of the fair market value that is determined by local assessors to be the total taxable value of land and additions on the property. | Land | Improvement |
|---|---|---|---|---|
| 2025 | $2,859 | $660,300 | $291,900 | $368,400 |
| 2024 | $2,754 | $627,300 | $280,700 | $346,600 |
| 2023 | $2,664 | $570,400 | $255,200 | $315,200 |
| 2022 | $2,650 | $473,200 | $240,600 | $232,600 |
| 2021 | $2,896 | $420,400 | $235,800 | $184,600 |
| 2020 | $2,871 | $470,700 | $262,000 | $208,700 |
| 2019 | $0 | $438,800 | $256,900 | $181,900 |
| 2018 | $2,474 | $377,000 | $205,400 | $171,600 |
| 2017 | $2,319 | $377,000 | $205,400 | $171,600 |
| 2016 | $2,255 | $345,300 | $200,500 | $144,800 |
| 2015 | $2,210 | $345,300 | $200,500 | $144,800 |
| 2014 | $2,132 | $335,800 | $195,600 | $140,200 |
Source: Public Records
Map
Nearby Homes
- 1 Belmont Rd Unit 630
- 1 Belmont Rd Unit 513
- 1 E Belmont Unit 630
- 26 Manning Rd
- 11 Ocean Park W
- 3 Fairbanks Dr
- 9 Chase Ave Unit 6
- 159 Center St Unit 22
- 402 Old Wharf Rd
- 402 Old Wharf Rd
- 405 Old Wharf Rd Unit B204
- 405 Old Wharf Rd Unit B204
- 73 Division St
- 12 Cross St
- 19 Riverway
- 148 Belmont Rd
- 19 Riverway
- 102 Sea St
- 24 Chase St
- 24 Chase St