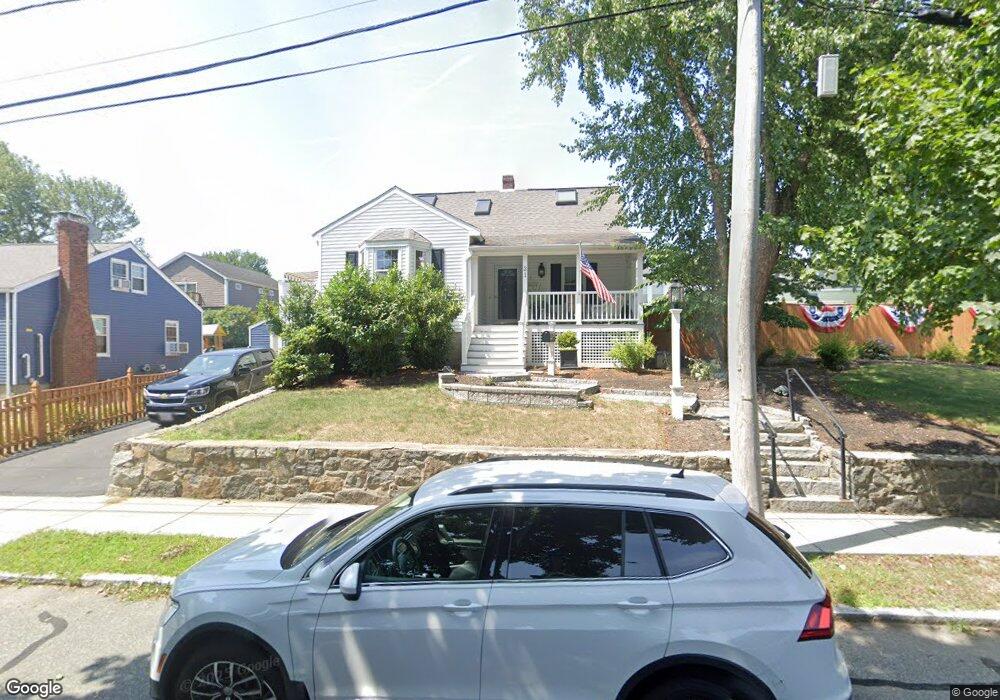
31 Calvin Rd Quincy, MA 02169
Merrymount NeighborhoodEstimated Value: $705,000 - $820,000
3
Beds
2
Baths
1,871
Sq Ft
$413/Sq Ft
Est. Value
About This Home
This home is located at 31 Calvin Rd, Quincy, MA 02169 and is currently estimated at $771,816, approximately $412 per square foot. 31 Calvin Rd is a home located in Norfolk County with nearby schools including Merrymount Elementary School, Broad Meadows Middle School, and Quincy High School.
Ownership History
Date
Name
Owned For
Owner Type
Purchase Details
Closed on
Sep 4, 2025
Sold by
Campbell Paul R and Campbell Barbara J
Bought by
Campbell Ft and Campbell
Current Estimated Value
Purchase Details
Closed on
Jun 6, 1985
Bought by
Campbell Paul R
Create a Home Valuation Report for This Property
The Home Valuation Report is an in-depth analysis detailing your home's value as well as a comparison with similar homes in the area
Home Values in the Area
Average Home Value in this Area
Purchase History
| Date | Buyer | Sale Price | Title Company |
|---|---|---|---|
| Campbell Ft | -- | -- | |
| Campbell Paul R | -- | -- |
Source: Public Records
Mortgage History
| Date | Status | Borrower | Loan Amount |
|---|---|---|---|
| Previous Owner | Campbell Paul R | $89,000 | |
| Previous Owner | Campbell Paul R | $20,000 | |
| Previous Owner | Campbell Paul R | $62,000 |
Source: Public Records
Tax History Compared to Growth
Tax History
| Year | Tax Paid | Tax Assessment Tax Assessment Total Assessment is a certain percentage of the fair market value that is determined by local assessors to be the total taxable value of land and additions on the property. | Land | Improvement |
|---|---|---|---|---|
| 2025 | $7,975 | $691,700 | $329,100 | $362,600 |
| 2024 | $7,655 | $679,200 | $319,600 | $359,600 |
| 2023 | $6,709 | $602,800 | $277,900 | $324,900 |
| 2022 | $6,859 | $572,500 | $252,800 | $319,700 |
| 2021 | $6,804 | $560,500 | $252,800 | $307,700 |
| 2020 | $6,839 | $550,200 | $243,100 | $307,100 |
| 2019 | $6,245 | $497,600 | $227,200 | $270,400 |
| 2018 | $6,103 | $457,500 | $197,700 | $259,800 |
| 2017 | $5,922 | $417,900 | $197,700 | $220,200 |
| 2016 | $5,767 | $401,600 | $197,700 | $203,900 |
| 2015 | $5,571 | $381,600 | $186,500 | $195,100 |
| 2014 | $5,134 | $345,500 | $177,600 | $167,900 |
Source: Public Records
Map
Nearby Homes
- 37 Hobomack Rd
- 503 Sea St
- 73 Albatross Rd
- 188 Samoset Ave
- 105 Sea St Unit 301
- 105 Sea St Unit 203
- 105 Sea St Unit 105
- 1427 Quincy Shore Dr
- 1421 Quincy Shore Dr
- 599 Sea St
- 599 Sea St Unit 1
- 200 Cove Way Unit 614
- 12 Quentin St
- 10 Forbush Ave
- 313 Washington St
- 161 Sumner St Unit 2
- 161 Sumner St Unit 4
- 16 Perley Place
- 187 Washington St
- 66 Mcgrath Hwy Unit 407