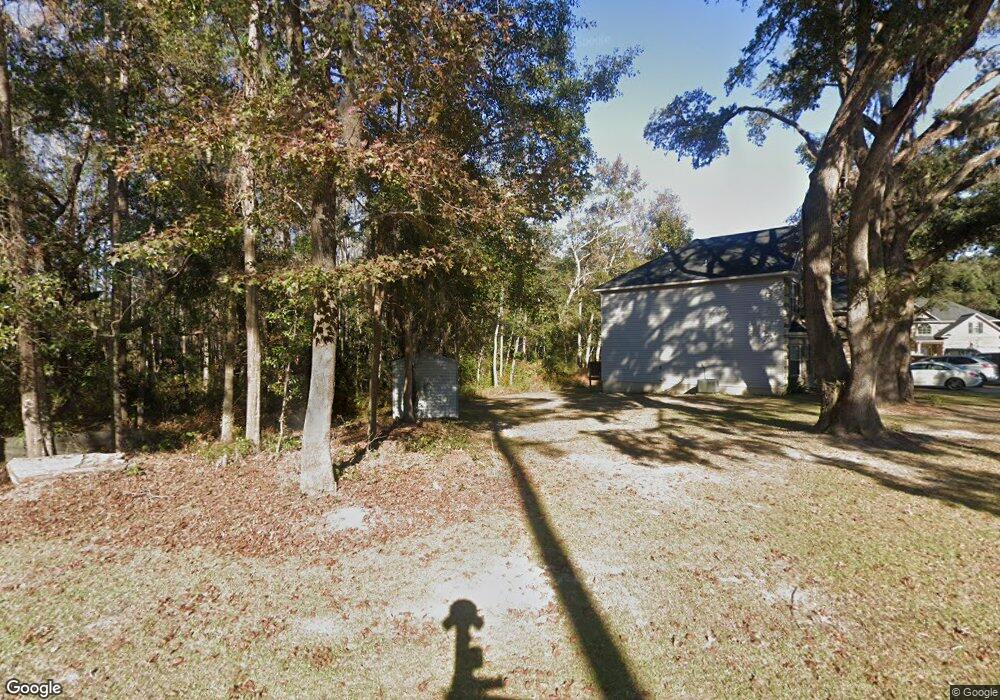
31 Carriage Way Midway, GA 31320
Estimated Value: $345,534 - $391,000
4
Beds
3
Baths
2,251
Sq Ft
$162/Sq Ft
Est. Value
About This Home
This home is located at 31 Carriage Way, Midway, GA 31320 and is currently estimated at $364,884, approximately $162 per square foot. 31 Carriage Way is a home located in Liberty County with nearby schools including Liberty Elementary School, Midway Middle School, and Liberty County High School.
Ownership History
Date
Name
Owned For
Owner Type
Purchase Details
Closed on
Oct 31, 2017
Sold by
Keeler Ashley N
Bought by
Lawson Harold D
Current Estimated Value
Home Financials for this Owner
Home Financials are based on the most recent Mortgage that was taken out on this home.
Original Mortgage
$208,386
Outstanding Balance
$173,783
Interest Rate
3.85%
Mortgage Type
VA
Estimated Equity
$191,101
Purchase Details
Closed on
Jan 12, 2017
Sold by
Rts Homes Llc
Bought by
Keeler Ashley N and Keeler Clayton R
Home Financials for this Owner
Home Financials are based on the most recent Mortgage that was taken out on this home.
Original Mortgage
$201,138
Interest Rate
4.16%
Mortgage Type
VA
Purchase Details
Closed on
Sep 13, 2016
Bought by
Rts Homes Llc
Purchase Details
Closed on
Aug 16, 2004
Bought by
Mulberry Company Llc
Create a Home Valuation Report for This Property
The Home Valuation Report is an in-depth analysis detailing your home's value as well as a comparison with similar homes in the area
Home Values in the Area
Average Home Value in this Area
Purchase History
| Date | Buyer | Sale Price | Title Company |
|---|---|---|---|
| Lawson Harold D | $204,000 | -- | |
| Keeler Ashley N | $196,905 | -- | |
| Rts Homes Llc | $30,000 | -- | |
| Mulberry Company Llc | $160,000 | -- |
Source: Public Records
Mortgage History
| Date | Status | Borrower | Loan Amount |
|---|---|---|---|
| Open | Lawson Harold D | $208,386 | |
| Previous Owner | Keeler Ashley N | $201,138 |
Source: Public Records
Tax History Compared to Growth
Tax History
| Year | Tax Paid | Tax Assessment Tax Assessment Total Assessment is a certain percentage of the fair market value that is determined by local assessors to be the total taxable value of land and additions on the property. | Land | Improvement |
|---|---|---|---|---|
| 2024 | $53 | $125,753 | $18,000 | $107,753 |
| 2023 | $53 | $118,207 | $14,400 | $103,807 |
| 2022 | $51 | $98,407 | $14,400 | $84,007 |
| 2021 | $51 | $86,396 | $14,400 | $71,996 |
| 2020 | $48 | $77,680 | $14,400 | $63,280 |
| 2019 | $48 | $77,334 | $14,400 | $62,934 |
| 2018 | $2,912 | $77,334 | $14,400 | $62,934 |
| 2017 | $3,281 | $77,334 | $14,400 | $62,934 |
| 2016 | $207 | $6,000 | $6,000 | $0 |
| 2015 | $314 | $7,200 | $7,200 | $0 |
| 2014 | $314 | $9,000 | $9,000 | $0 |
| 2013 | -- | $9,000 | $9,000 | $0 |
Source: Public Records
Map
Nearby Homes
- 338 Cottage Loop
- 244 Cottage Loop
- 45 Veranda Trail
- 23 Veranda Trail
- 247 Old Gress Island Rd
- 141 Colonial Dr
- 80 Shady Oaks Loop
- O Marie, Lot 27 Marie Ave
- 0 Marie, Lot 2 Marie Ave
- 0 Marie, Lot 26 Marie Ave
- 0 Marie lot 15 Marie Ave
- 0 Marie Lot 9 Marie Ave
- 106 Calico Ct
- 177 Winoca Dr
- 151 Hollingsworth Blvd
- 78 Button Gwinnett Ave
- 229 Hollingsworth Blvd
- 81 Button Gwinnett Ave
- 161 C Jones St
- 58 Saint Catherine St
- 11 Carriage Way
- 56 Carriage Way
- 44 Carriage Way
- 10 Carriage Way
- 3 Carriage Way
- 2 Carriage Way
- 141 Carriage Way
- 0 Windy Oaks Ln Unit 120890
- 0 Windy Oaks Ln Unit 120899
- 0 Windy Oaks Ln Unit 2632381
- 0 Windy Oaks Ln Unit 2632370
- 224-227 Carriage Way
- lot37 Carriage Way
- Lot 27 Carriage Way
- Lot 35 Carriage Way
- 505 Betts Ln
- 37 Carriage Way
- 35 Carriage Way
- 27 Carriage Way
- 159 Carriage Way