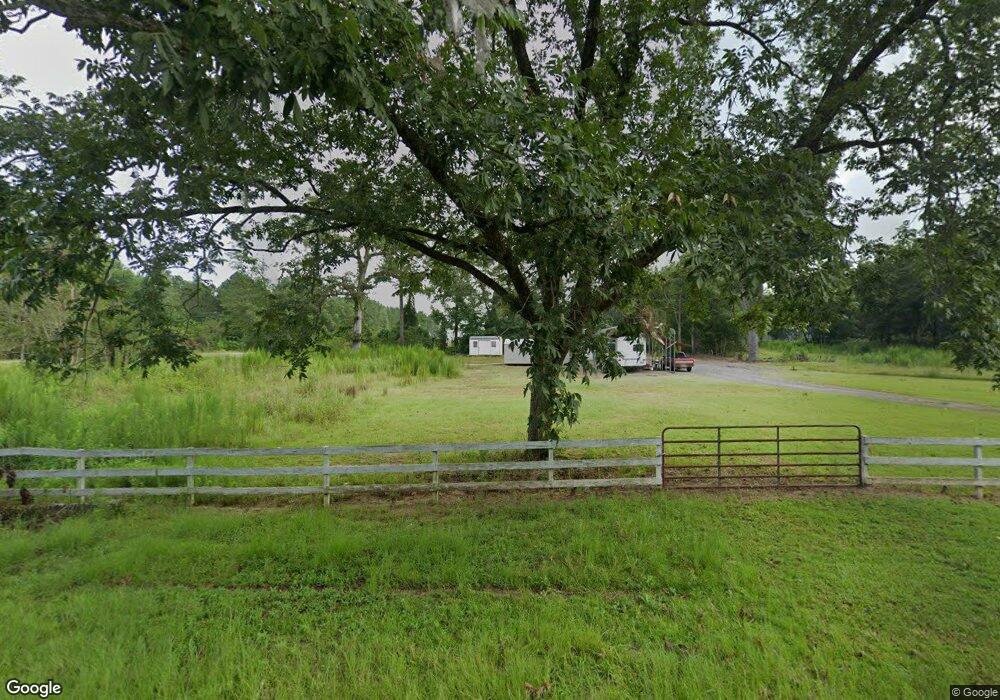
31 Charles Cheney Rd Morgan, GA 39866
Estimated Value: $50,716 - $123,000
Studio
1
Bath
1,712
Sq Ft
$57/Sq Ft
Est. Value
About This Home
This home is located at 31 Charles Cheney Rd, Morgan, GA 39866 and is currently estimated at $97,679, approximately $57 per square foot. 31 Charles Cheney Rd is a home located in Calhoun County with nearby schools including Calhoun County Elementary School, Calhoun County Middle School, and Calhoun County High School.
Ownership History
Date
Name
Owned For
Owner Type
Purchase Details
Closed on
Nov 11, 2025
Sold by
Ellison William Freeman
Bought by
Turner Kallie
Current Estimated Value
Purchase Details
Closed on
Sep 21, 2020
Sold by
Ruiz Martin A
Bought by
Ellison William Freeman
Home Financials for this Owner
Home Financials are based on the most recent Mortgage that was taken out on this home.
Original Mortgage
$10,000
Interest Rate
2.9%
Mortgage Type
New Conventional
Purchase Details
Closed on
Jan 31, 2006
Sold by
Ruiz Martin A
Bought by
Ruiz Martin A and Ruiz Adela C
Home Financials for this Owner
Home Financials are based on the most recent Mortgage that was taken out on this home.
Original Mortgage
$44,175
Interest Rate
6.14%
Mortgage Type
New Conventional
Purchase Details
Closed on
Jan 26, 2006
Sold by
Brazel Johnny
Bought by
Brazel Rebecca M
Home Financials for this Owner
Home Financials are based on the most recent Mortgage that was taken out on this home.
Original Mortgage
$44,175
Interest Rate
6.14%
Mortgage Type
New Conventional
Create a Home Valuation Report for This Property
The Home Valuation Report is an in-depth analysis detailing your home's value as well as a comparison with similar homes in the area
Purchase History
| Date | Buyer | Sale Price | Title Company |
|---|---|---|---|
| Turner Kallie | -- | -- | |
| Ellison William Freeman | $20,000 | -- | |
| Ruiz Martin A | -- | -- | |
| Ruiz Martin A | $46,500 | -- | |
| Brazel Rebecca M | -- | -- | |
| Brazel Rebecca M | -- | -- | |
| Brazel Rebecca M | -- | -- | |
| Brazel Rebecca M | -- | -- |
Source: Public Records
Mortgage History
| Date | Status | Borrower | Loan Amount |
|---|---|---|---|
| Previous Owner | Ellison William Freeman | $10,000 | |
| Previous Owner | Ruiz Martin A | $44,175 | |
| Previous Owner | Brazel Rebecca M | $44,175 |
Source: Public Records
Tax History
| Year | Tax Paid | Tax Assessment Tax Assessment Total Assessment is a certain percentage of the fair market value that is determined by local assessors to be the total taxable value of land and additions on the property. | Land | Improvement |
|---|---|---|---|---|
| 2025 | $341 | $9,956 | $3,043 | $6,913 |
| 2024 | $341 | $9,956 | $3,043 | $6,913 |
| 2023 | $343 | $9,956 | $3,043 | $6,913 |
| 2022 | $336 | $9,756 | $3,043 | $6,713 |
| 2021 | $168 | $4,783 | $3,043 | $1,740 |
| 2020 | $173 | $4,783 | $3,043 | $1,740 |
| 2019 | $471 | $17,969 | $3,043 | $14,926 |
| 2018 | $621 | $17,969 | $3,043 | $14,926 |
| 2017 | $570 | $17,969 | $3,043 | $14,926 |
| 2016 | $570 | $17,969 | $3,043 | $14,926 |
| 2015 | -- | $17,569 | $3,043 | $14,526 |
| 2014 | -- | $17,930 | $3,043 | $14,887 |
| 2013 | -- | $17,958 | $3,043 | $14,914 |
Source: Public Records
Map
Nearby Homes
- 2176 Ga Highway 41
- 2430 Georgia 41
- 2432 Georgia 41
- 2432 Ga Highway 41
- 3386 Dickey Bypass Rd
- 2608 S Ga Hwy 41
- 1460 Ga Highway 41
- 3715 Dickey Bypass
- 1734 Ga Highway 41
- 1332 Ga Highway 41
- 355 Beard Rd
- 2679 Ga Highway 41
- 2679 Ga Highway 41
- 1386 Ga Highway 41
- 197 Langs Rd
- 977 Charles Cheney Rd
- 3056 Ga Highway 41
Your Personal Tour Guide
Ask me questions while you tour the home.