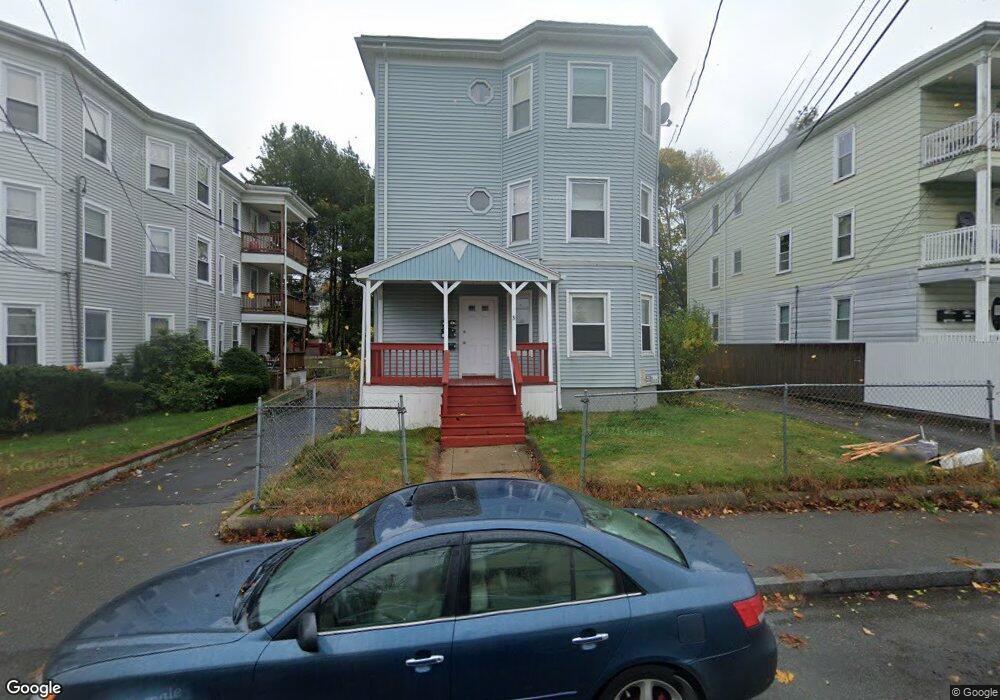
31 Clarence St Brockton, MA 02301
Montello NeighborhoodEstimated Value: $660,000 - $916,000
12
Beds
3
Baths
3,933
Sq Ft
$203/Sq Ft
Est. Value
About This Home
This home is located at 31 Clarence St, Brockton, MA 02301 and is currently estimated at $797,333, approximately $202 per square foot. 31 Clarence St is a home located in Plymouth County with nearby schools including Raymond K-8 Elementary School, Louis F Angelo Elementary School, and Manthala George Jr. School.
Ownership History
Date
Name
Owned For
Owner Type
Purchase Details
Closed on
Apr 3, 2008
Sold by
Indymac Bank Fsb
Bought by
Duarte Odilio C
Current Estimated Value
Home Financials for this Owner
Home Financials are based on the most recent Mortgage that was taken out on this home.
Original Mortgage
$177,100
Outstanding Balance
$112,711
Interest Rate
6.06%
Mortgage Type
Purchase Money Mortgage
Estimated Equity
$684,622
Purchase Details
Closed on
Sep 13, 2007
Sold by
Kelley Christopher L
Bought by
Indymac Bk
Purchase Details
Closed on
Jun 26, 2006
Sold by
Brooks Kirk O
Bought by
Kelley Christopher L
Purchase Details
Closed on
Feb 23, 2005
Sold by
Brooks Glen E
Bought by
Clarence Street Rt
Purchase Details
Closed on
Sep 28, 2004
Sold by
Brooks Pauline V
Bought by
Broks Glen E
Purchase Details
Closed on
Aug 7, 2000
Sold by
Smith Kathleen M
Bought by
Brooks Pauline V
Create a Home Valuation Report for This Property
The Home Valuation Report is an in-depth analysis detailing your home's value as well as a comparison with similar homes in the area
Home Values in the Area
Average Home Value in this Area
Purchase History
| Date | Buyer | Sale Price | Title Company |
|---|---|---|---|
| Duarte Odilio C | $230,000 | -- | |
| Duarte Odilio C | $230,000 | -- | |
| Indymac Bk | $360,000 | -- | |
| Indymac Bk | $360,000 | -- | |
| Kelley Christopher L | $480,000 | -- | |
| Kelley Christopher L | $480,000 | -- | |
| Clarence Street Rt | -- | -- | |
| Clarence Street Rt | -- | -- | |
| Broks Glen E | -- | -- | |
| Broks Glen E | -- | -- | |
| Brooks Pauline V | $214,900 | -- | |
| Brooks Pauline V | $214,900 | -- |
Source: Public Records
Mortgage History
| Date | Status | Borrower | Loan Amount |
|---|---|---|---|
| Open | Brooks Pauline V | $177,100 |
Source: Public Records
Tax History Compared to Growth
Tax History
| Year | Tax Paid | Tax Assessment Tax Assessment Total Assessment is a certain percentage of the fair market value that is determined by local assessors to be the total taxable value of land and additions on the property. | Land | Improvement |
|---|---|---|---|---|
| 2025 | $8,564 | $707,200 | $135,600 | $571,600 |
| 2024 | $8,414 | $700,000 | $135,600 | $564,400 |
| 2023 | $7,692 | $592,600 | $101,600 | $491,000 |
| 2022 | $7,304 | $522,800 | $92,100 | $430,700 |
| 2021 | $6,909 | $476,500 | $76,100 | $400,400 |
| 2020 | $6,687 | $441,400 | $71,800 | $369,600 |
| 2019 | $6,505 | $418,600 | $69,300 | $349,300 |
| 2018 | $5,907 | $367,800 | $69,300 | $298,500 |
| 2017 | $5,268 | $327,200 | $69,300 | $257,900 |
| 2016 | $5,276 | $303,900 | $67,200 | $236,700 |
| 2015 | $3,949 | $217,600 | $67,200 | $150,400 |
| 2014 | $3,738 | $206,200 | $67,200 | $139,000 |
Source: Public Records
Map
Nearby Homes
- 33 Clarence St
- 25 Clarence St
- 21 Clarence St
- 35 Clarence St
- 35 Clarence St Unit 2
- 18 Snell St
- 30 Snell St
- 28 Clarence St
- 22 Snell St
- 22 Snell St Unit 1
- 24 Snell St Unit 2
- 17 Clarence St
- 17 Clarence St Unit 3
- 17 Clarence St Unit 2
- 39 Clarence St
- 39 Clarence St Unit 2
- 32 Clarence St
- 26 Clarence St
- 22 Clarence St
- 40 Clarence St