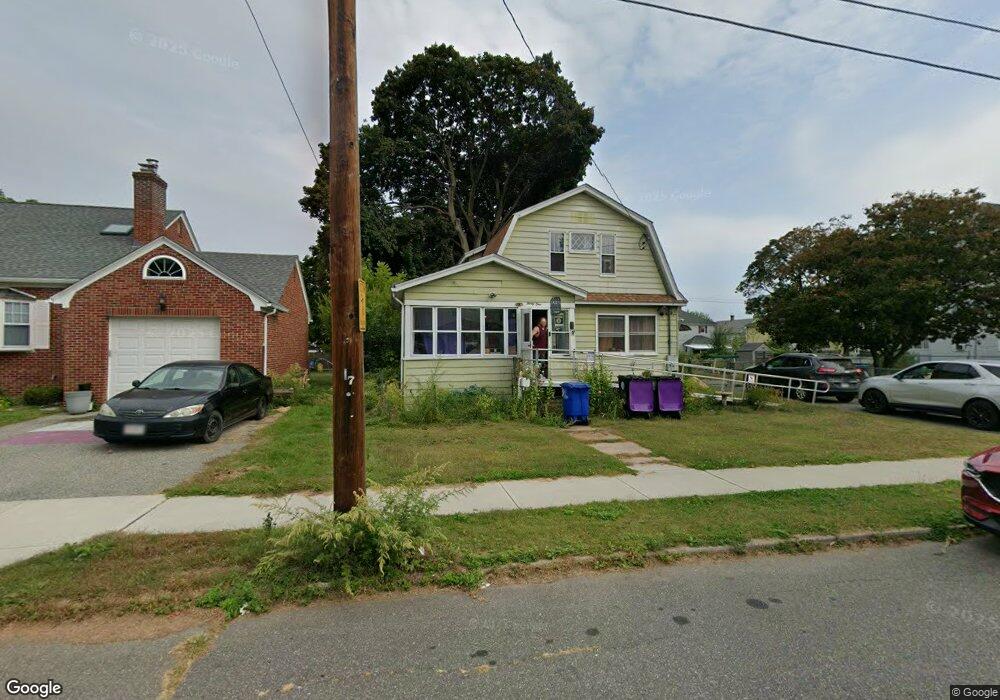
31 Clark St Holyoke, MA 01040
Estimated Value: $285,000 - $331,000
4
Beds
1
Bath
1,570
Sq Ft
$199/Sq Ft
Est. Value
About This Home
This home is located at 31 Clark St, Holyoke, MA 01040 and is currently estimated at $312,998, approximately $199 per square foot. 31 Clark St is a home located in Hampden County with nearby schools including Maurice A. Donahue Elementary School, Holyoke High School, and Holyoke Community Charter School.
Ownership History
Date
Name
Owned For
Owner Type
Purchase Details
Closed on
Jan 26, 2000
Sold by
Mccool Dean H
Bought by
Morrison Jean N
Current Estimated Value
Home Financials for this Owner
Home Financials are based on the most recent Mortgage that was taken out on this home.
Original Mortgage
$95,351
Outstanding Balance
$30,760
Interest Rate
7.83%
Mortgage Type
Purchase Money Mortgage
Estimated Equity
$282,238
Create a Home Valuation Report for This Property
The Home Valuation Report is an in-depth analysis detailing your home's value as well as a comparison with similar homes in the area
Home Values in the Area
Average Home Value in this Area
Purchase History
| Date | Buyer | Sale Price | Title Company |
|---|---|---|---|
| Morrison Jean N | $95,400 | -- |
Source: Public Records
Mortgage History
| Date | Status | Borrower | Loan Amount |
|---|---|---|---|
| Open | Morrison Jean N | $14,364 | |
| Open | Morrison Jean N | $95,351 | |
| Previous Owner | Morrison Jean N | $64,000 | |
| Previous Owner | Morrison Jean N | $57,472 |
Source: Public Records
Tax History Compared to Growth
Tax History
| Year | Tax Paid | Tax Assessment Tax Assessment Total Assessment is a certain percentage of the fair market value that is determined by local assessors to be the total taxable value of land and additions on the property. | Land | Improvement |
|---|---|---|---|---|
| 2025 | $4,126 | $236,300 | $49,700 | $186,600 |
| 2024 | $3,798 | $200,400 | $47,500 | $152,900 |
| 2023 | $3,634 | $193,700 | $47,500 | $146,200 |
| 2022 | $3,544 | $184,000 | $47,500 | $136,500 |
| 2021 | $3,322 | $172,400 | $43,300 | $129,100 |
| 2020 | $3,152 | $165,200 | $43,300 | $121,900 |
| 2019 | $3,054 | $158,300 | $43,300 | $115,000 |
| 2018 | $2,912 | $152,200 | $43,300 | $108,900 |
| 2017 | $2,918 | $152,200 | $43,300 | $108,900 |
| 2016 | $2,891 | $151,200 | $44,500 | $106,700 |
| 2015 | $2,879 | $151,200 | $44,500 | $106,700 |
Source: Public Records
Map
Nearby Homes