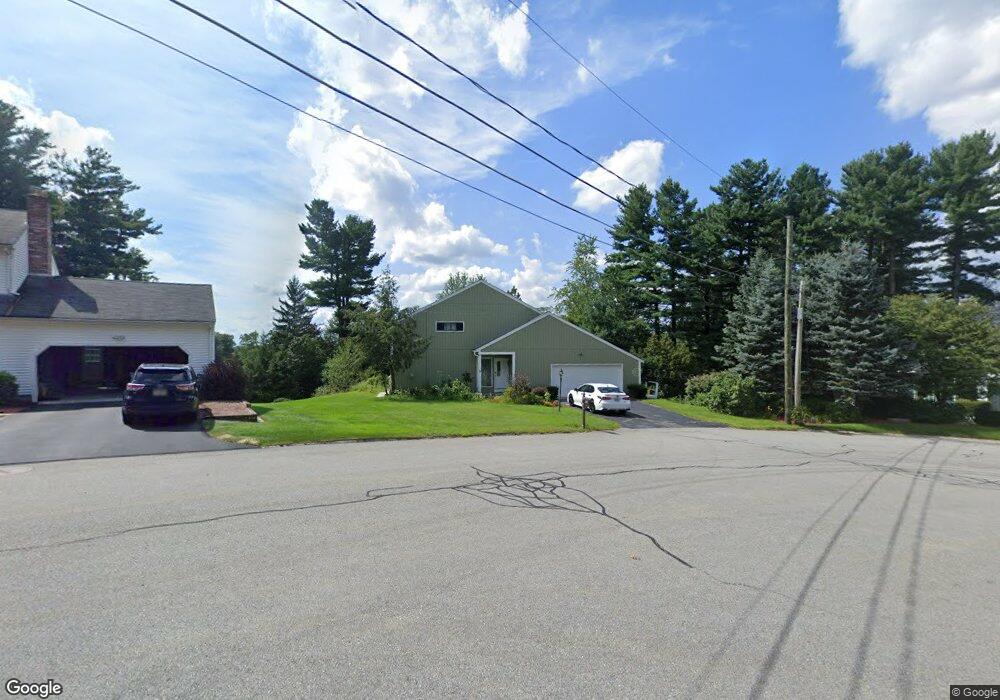
31 Clear View Dr Nashua, NH 03062
Southwest Nashua NeighborhoodEstimated Value: $722,714 - $794,000
4
Beds
4
Baths
2,392
Sq Ft
$315/Sq Ft
Est. Value
About This Home
This home is located at 31 Clear View Dr, Nashua, NH 03062 and is currently estimated at $754,429, approximately $315 per square foot. 31 Clear View Dr is a home located in Hillsborough County with nearby schools including Bicentennial Elementary School, Fairgrounds Middle School, and Nashua High School South.
Ownership History
Date
Name
Owned For
Owner Type
Purchase Details
Closed on
Apr 1, 2011
Sold by
Venegas Manuel
Bought by
Lambright Henry D and Lambright Sue M
Current Estimated Value
Home Financials for this Owner
Home Financials are based on the most recent Mortgage that was taken out on this home.
Original Mortgage
$300,000
Interest Rate
5.04%
Mortgage Type
Purchase Money Mortgage
Create a Home Valuation Report for This Property
The Home Valuation Report is an in-depth analysis detailing your home's value as well as a comparison with similar homes in the area
Home Values in the Area
Average Home Value in this Area
Purchase History
| Date | Buyer | Sale Price | Title Company |
|---|---|---|---|
| Lambright Henry D | $375,000 | -- |
Source: Public Records
Mortgage History
| Date | Status | Borrower | Loan Amount |
|---|---|---|---|
| Open | Lambright Henry D | $292,400 | |
| Closed | Lambright Henry D | $300,000 | |
| Previous Owner | Lambright Henry D | $225,000 |
Source: Public Records
Tax History
| Year | Tax Paid | Tax Assessment Tax Assessment Total Assessment is a certain percentage of the fair market value that is determined by local assessors to be the total taxable value of land and additions on the property. | Land | Improvement |
|---|---|---|---|---|
| 2025 | $11,316 | $672,400 | $179,700 | $492,700 |
| 2024 | $10,511 | $661,100 | $179,700 | $481,400 |
| 2023 | $10,045 | $551,000 | $143,800 | $407,200 |
| 2022 | $9,957 | $551,000 | $143,800 | $407,200 |
| 2021 | $9,704 | $417,900 | $105,400 | $312,500 |
| 2020 | $9,465 | $418,600 | $105,400 | $313,200 |
| 2019 | $9,109 | $418,600 | $105,400 | $313,200 |
| 2018 | $8,879 | $418,600 | $105,400 | $313,200 |
| 2017 | $9,114 | $353,400 | $90,800 | $262,600 |
| 2016 | $8,860 | $353,400 | $90,800 | $262,600 |
| 2015 | $8,669 | $353,400 | $90,800 | $262,600 |
| 2014 | $8,499 | $353,400 | $90,800 | $262,600 |
Source: Public Records
Map
Nearby Homes
- 8 Oakdale Ave
- 8 Collier Ct
- 57 Timberline Dr
- 16 Emerson Rd
- 70 Spindlewick Dr
- 1 Thompson Rd Unit 109
- 3 Appaloosa Place
- 137 Peele Rd
- 6 Hayden St
- 25 Eastman St Unit 64
- 23 Eastman St
- 397 S Main St
- 15 Taschereau Blvd
- 22 Taschereau Blvd
- 256 E Dunstable Rd
- 4 Chelsea Ct
- 29 Nightingale Rd
- 21 Cannon Dr
- 17 Bicentennial Dr
- 5 Stafford Rd
Your Personal Tour Guide
Ask me questions while you tour the home.