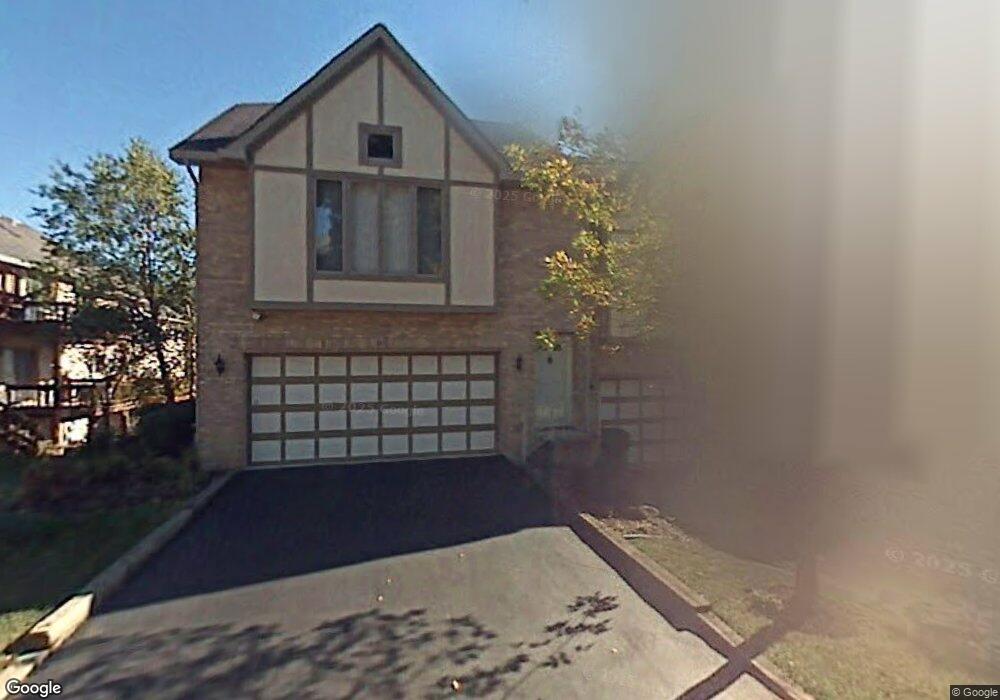
31 Cliffside Circle Dr Willow Springs, IL 60480
Estimated Value: $277,000 - $339,000
2
Beds
3
Baths
1,389
Sq Ft
$223/Sq Ft
Est. Value
About This Home
This home is located at 31 Cliffside Circle Dr, Willow Springs, IL 60480 and is currently estimated at $309,817, approximately $223 per square foot. 31 Cliffside Circle Dr is a home located in Cook County with nearby schools including Willow Springs Elementary School, Argo Community High School, and Trinity Lutheran School.
Ownership History
Date
Name
Owned For
Owner Type
Purchase Details
Closed on
Dec 8, 2017
Sold by
Schaffer James M and Schaffer Amy
Bought by
Bolec Richard H
Current Estimated Value
Home Financials for this Owner
Home Financials are based on the most recent Mortgage that was taken out on this home.
Original Mortgage
$105,000
Outstanding Balance
$87,917
Interest Rate
4%
Mortgage Type
New Conventional
Estimated Equity
$221,900
Purchase Details
Closed on
Jun 1, 2005
Sold by
Bolcerek Marilyn J
Bought by
Schaffer James M
Home Financials for this Owner
Home Financials are based on the most recent Mortgage that was taken out on this home.
Original Mortgage
$248,000
Interest Rate
5.87%
Mortgage Type
Fannie Mae Freddie Mac
Purchase Details
Closed on
Oct 28, 1997
Sold by
Bolcerek Marilyn J
Bought by
Bolcerek Marilyn J and Marilyn J Bolcerek Revocable Living Tr
Purchase Details
Closed on
Jul 24, 1995
Sold by
Cole Taylor Bank
Bought by
Bolcerek Marilyn J
Create a Home Valuation Report for This Property
The Home Valuation Report is an in-depth analysis detailing your home's value as well as a comparison with similar homes in the area
Home Values in the Area
Average Home Value in this Area
Purchase History
| Date | Buyer | Sale Price | Title Company |
|---|---|---|---|
| Bolec Richard H | $210,000 | Attorneys Title Guaranty Fun | |
| Schaffer James M | $310,000 | Pntn | |
| Bolcerek Marilyn J | -- | -- | |
| Bolcerek Marilyn J | $187,000 | Land Title Group Inc |
Source: Public Records
Mortgage History
| Date | Status | Borrower | Loan Amount |
|---|---|---|---|
| Open | Bolec Richard H | $105,000 | |
| Previous Owner | Schaffer James M | $248,000 |
Source: Public Records
Tax History
| Year | Tax Paid | Tax Assessment Tax Assessment Total Assessment is a certain percentage of the fair market value that is determined by local assessors to be the total taxable value of land and additions on the property. | Land | Improvement |
|---|---|---|---|---|
| 2025 | $5,737 | $22,000 | $1,639 | $20,361 |
| 2024 | $5,737 | $22,000 | $1,639 | $20,361 |
| 2023 | $6,722 | $22,000 | $1,639 | $20,361 |
| 2022 | $6,722 | $20,017 | $1,426 | $18,591 |
| 2021 | $6,661 | $20,015 | $1,425 | $18,590 |
| 2020 | $6,561 | $20,015 | $1,425 | $18,590 |
| 2019 | $7,135 | $21,000 | $1,282 | $19,718 |
| 2018 | $6,908 | $21,000 | $1,282 | $19,718 |
| 2017 | $8,878 | $26,011 | $1,282 | $24,729 |
| 2016 | $7,844 | $20,655 | $1,140 | $19,515 |
| 2015 | $8,066 | $22,563 | $1,140 | $21,423 |
| 2014 | $7,933 | $22,563 | $1,140 | $21,423 |
| 2013 | $6,630 | $21,086 | $1,140 | $19,946 |
Source: Public Records
Map
Nearby Homes
- 8832 Rust St Unit 3
- 8832 Rust St Unit 2
- 8832 Rust St Unit 1
- 400 Village Cir Unit 108
- 219 Willow Blvd Unit 1202B
- 123 Willow Blvd Unit 205C
- 300 Village Cir Unit 503
- 8518 Archer Ave
- 8422 Archer Ave
- 102 Park St
- 131 Willow Creek Ln
- 9051 Archer Ave
- 125 Willows Edge Ct Unit C
- 11008 84th Place
- 11216 85th Place
- 11307 German Church Rd
- 120 Fairway Dr
- Lot 4 S Kean Ave
- Lot 6 S Kean Ave
- Lot 1 S Kean Ave
- 32 Cliffside Circle Dr
- 29 Cliffside Circle Dr
- 30 Cliffside Circle Dr
- 28 Cliffside Circle Dr
- 27 Cliffside Circle Dr
- 34 Cliffside Circle Dr
- 35 Cliffside Circle Dr
- 36 Cliffside Circle Dr
- 4 Cliffside Dr
- 5 Cliffside Circle Dr
- 4 Cliffside Circle Dr
- 26 Cliffside Circle Dr
- 6 Cliffside Circle Dr
- 7 Cliffside Circle Dr
- 25 Cliffside Circle Dr
- 8 Cliffside Circle Dr
- 3 Cliffside Circle Dr
- 1 Cliffside Circle Dr
- 9 Cliffside Circle Dr
- 2 Cliffside Circle Dr
Your Personal Tour Guide
Ask me questions while you tour the home.