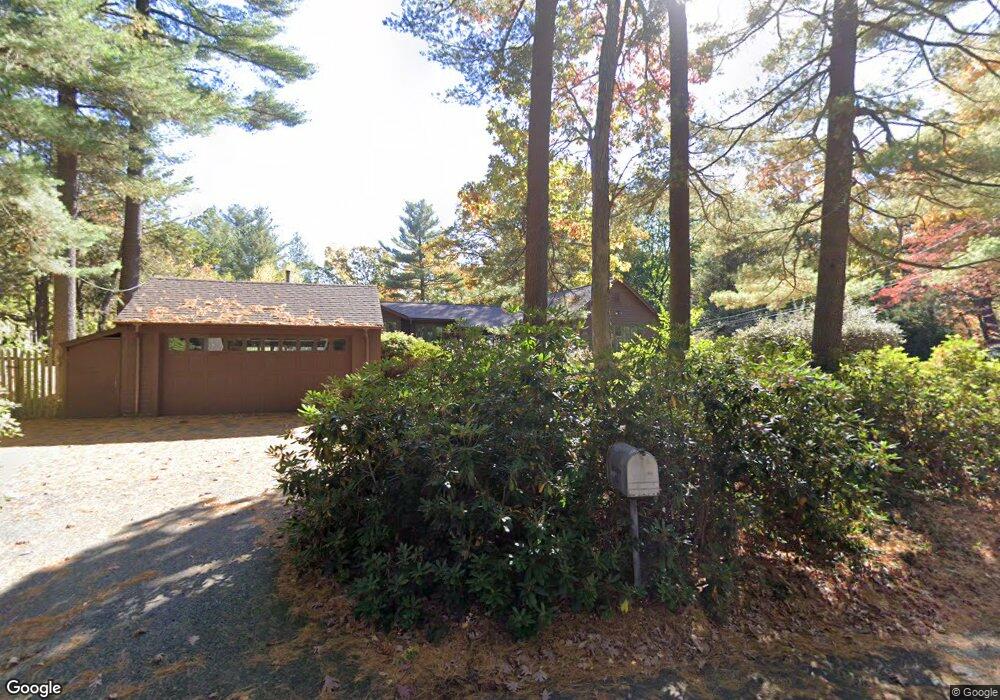
31 Coburn Rd Weston, MA 02493
Estimated Value: $1,214,000 - $2,390,000
2
Beds
2
Baths
1,985
Sq Ft
$853/Sq Ft
Est. Value
About This Home
This home is located at 31 Coburn Rd, Weston, MA 02493 and is currently estimated at $1,693,376, approximately $853 per square foot. 31 Coburn Rd is a home located in Middlesex County with nearby schools including Country Elementary School, Woodland Elementary School, and Weston Middle School.
Ownership History
Date
Name
Owned For
Owner Type
Purchase Details
Closed on
Nov 6, 2024
Sold by
Hutcheson John G and Hutcheson Kimberly
Bought by
Hutcheson David M
Current Estimated Value
Purchase Details
Closed on
Nov 5, 2024
Sold by
Hutcheson Nt and Hutcheson
Bought by
Hutcheson David M and Hutcheson David M
Purchase Details
Closed on
Nov 3, 2024
Sold by
Hutcheson David M and Hutcheson Emily L
Bought by
David Mahard Hutcheson T and David Hutcheson
Create a Home Valuation Report for This Property
The Home Valuation Report is an in-depth analysis detailing your home's value as well as a comparison with similar homes in the area
Home Values in the Area
Average Home Value in this Area
Purchase History
| Date | Buyer | Sale Price | Title Company |
|---|---|---|---|
| Hutcheson David M | $300,000 | None Available | |
| Hutcheson David M | $300,000 | None Available | |
| Hutcheson David M | -- | None Available | |
| Hutcheson David M | -- | None Available | |
| Hutcheson John G | -- | None Available | |
| David Mahard Hutcheson T | -- | None Available | |
| David Mahard Hutcheson T | -- | None Available |
Source: Public Records
Tax History Compared to Growth
Tax History
| Year | Tax Paid | Tax Assessment Tax Assessment Total Assessment is a certain percentage of the fair market value that is determined by local assessors to be the total taxable value of land and additions on the property. | Land | Improvement |
|---|---|---|---|---|
| 2025 | $15,913 | $1,433,600 | $1,012,800 | $420,800 |
| 2024 | $15,180 | $1,365,100 | $1,012,800 | $352,300 |
| 2023 | $1,025 | $1,300,100 | $1,012,800 | $287,300 |
| 2022 | $961 | $1,184,100 | $954,200 | $229,900 |
| 2021 | $14,722 | $1,134,200 | $914,600 | $219,600 |
| 2020 | $14,552 | $1,134,200 | $914,600 | $219,600 |
| 2019 | $14,234 | $1,130,600 | $914,600 | $216,000 |
| 2018 | $14,144 | $1,130,600 | $914,600 | $216,000 |
| 2017 | $14,019 | $1,130,600 | $914,600 | $216,000 |
| 2016 | $13,737 | $1,129,700 | $914,600 | $215,100 |
| 2015 | $13,353 | $1,087,400 | $876,800 | $210,600 |
Source: Public Records
Map
Nearby Homes
- 120 Church St
- 51 Church St
- 15 Whitney Tavern Rd
- 17 Lexington St
- 167 Conant Rd
- 60 Rolling Ln
- 6 Overlook Dr
- 3 October Ln
- 4 Willow Rd
- 8 Jericho Rd Unit 8
- 24 Jericho Rd Unit 24
- 202 Bear Hill Rd
- 226 Ash St
- 1 Aberdeen Rd
- 52 Jericho Rd Unit 52
- 11 Winthrop Cir
- 51 Willard Rd
- 154 Newton St
- 9 Atlas Ln
- 180 Ash St