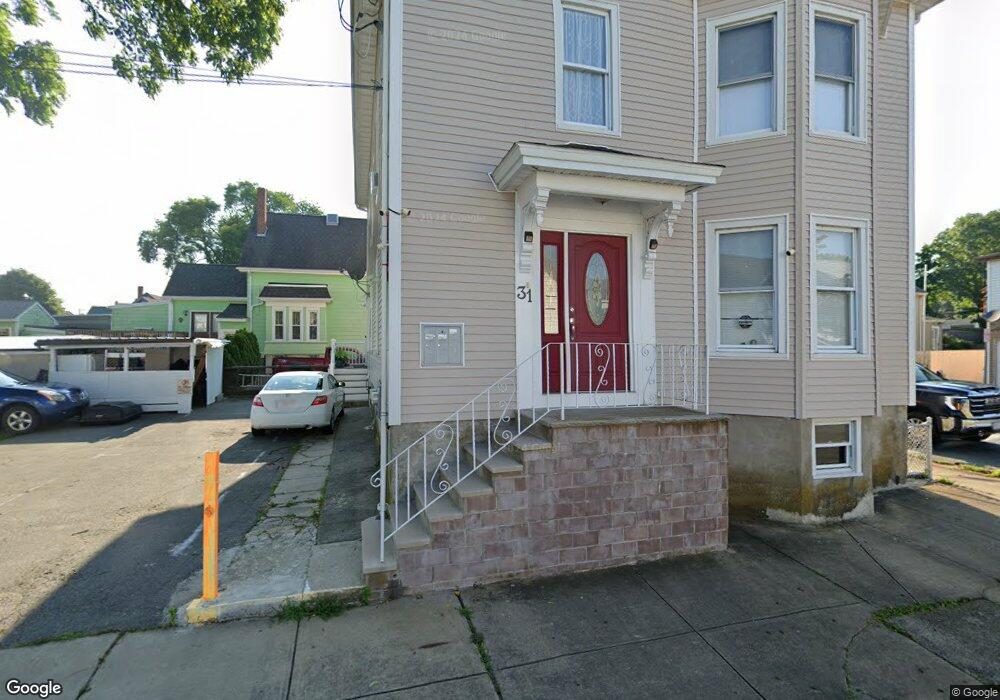
31 Cottage St New Bedford, MA 02740
The South End NeighborhoodEstimated Value: $598,404 - $772,000
8
Beds
3
Baths
3,355
Sq Ft
$201/Sq Ft
Est. Value
About This Home
This home is located at 31 Cottage St, New Bedford, MA 02740 and is currently estimated at $675,601, approximately $201 per square foot. 31 Cottage St is a home located in Bristol County with nearby schools including James B. Congdon Elementary, Roosevelt Middle School, and New Bedford High School.
Ownership History
Date
Name
Owned For
Owner Type
Purchase Details
Closed on
Mar 31, 2021
Sold by
A & E Rt
Bought by
Teixeira Beleza and Teixeira Mario
Current Estimated Value
Home Financials for this Owner
Home Financials are based on the most recent Mortgage that was taken out on this home.
Original Mortgage
$400,610
Outstanding Balance
$360,529
Interest Rate
2.8%
Mortgage Type
FHA
Estimated Equity
$315,072
Purchase Details
Closed on
Feb 22, 2011
Sold by
Oliveira Ronald
Bought by
A & E Rt
Purchase Details
Closed on
Dec 17, 2010
Sold by
Macedo Nelson M
Bought by
Greenwich Investors Ll
Purchase Details
Closed on
Aug 31, 1988
Sold by
Arruda Ernestine M
Bought by
Macedo Nelson M
Create a Home Valuation Report for This Property
The Home Valuation Report is an in-depth analysis detailing your home's value as well as a comparison with similar homes in the area
Home Values in the Area
Average Home Value in this Area
Purchase History
| Date | Buyer | Sale Price | Title Company |
|---|---|---|---|
| Teixeira Beleza | $408,000 | None Available | |
| Teixeira Beleza | $408,000 | None Available | |
| A & E Rt | -- | -- | |
| Oliveira Ronald | $110,000 | -- | |
| Oliveira Ronald | $110,000 | -- | |
| Greenwich Investors Ll | $353,464 | -- | |
| Greenwich Investors Ll | $353,464 | -- | |
| Macedo Nelson M | $10,000 | -- |
Source: Public Records
Mortgage History
| Date | Status | Borrower | Loan Amount |
|---|---|---|---|
| Open | Teixeira Beleza | $400,610 | |
| Closed | Teixeira Beleza | $400,610 | |
| Previous Owner | Macedo Nelson M | $150,000 |
Source: Public Records
Tax History Compared to Growth
Tax History
| Year | Tax Paid | Tax Assessment Tax Assessment Total Assessment is a certain percentage of the fair market value that is determined by local assessors to be the total taxable value of land and additions on the property. | Land | Improvement |
|---|---|---|---|---|
| 2025 | $6,601 | $583,600 | $98,100 | $485,500 |
| 2024 | $6,007 | $500,600 | $94,600 | $406,000 |
| 2023 | $5,473 | $383,000 | $79,200 | $303,800 |
| 2022 | $4,208 | $270,800 | $77,100 | $193,700 |
| 2021 | $4,063 | $260,600 | $73,600 | $187,000 |
| 2020 | $4,042 | $250,100 | $73,600 | $176,500 |
| 2019 | $3,528 | $214,200 | $73,600 | $140,600 |
| 2018 | $3,369 | $202,600 | $73,600 | $129,000 |
| 2017 | $3,168 | $189,800 | $75,400 | $114,400 |
| 2016 | $3,051 | $185,000 | $75,400 | $109,600 |
| 2015 | $2,850 | $181,200 | $75,400 | $105,800 |
| 2014 | $2,747 | $181,200 | $75,400 | $105,800 |
Source: Public Records
Map
Nearby Homes