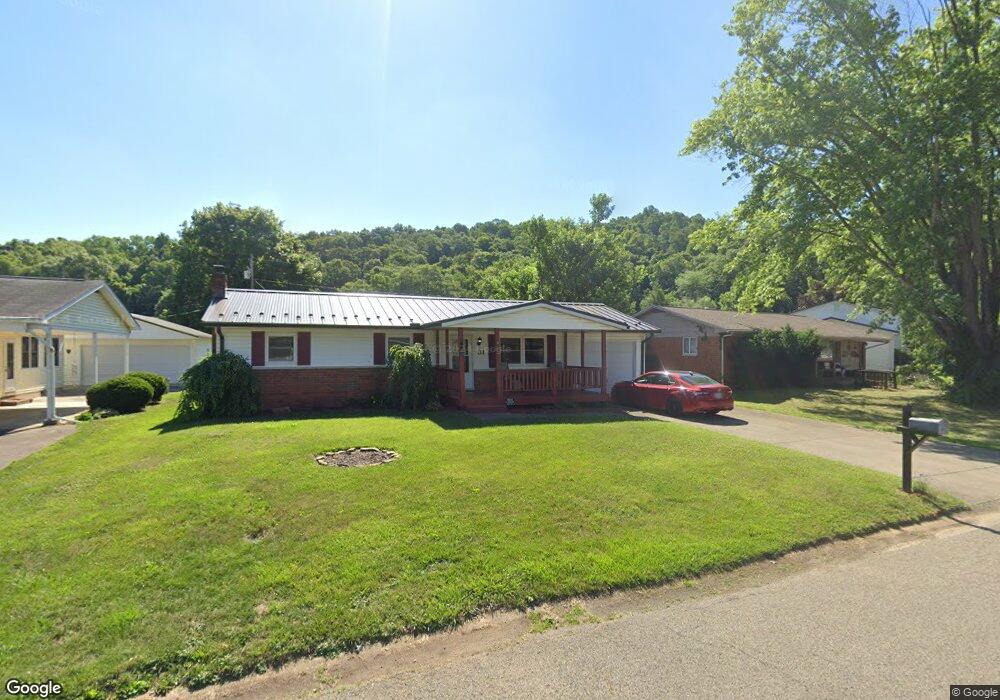
31 Coventry Dr Chillicothe, OH 45601
Estimated Value: $212,000 - $228,019
3
Beds
2
Baths
1,032
Sq Ft
$214/Sq Ft
Est. Value
About This Home
This home is located at 31 Coventry Dr, Chillicothe, OH 45601 and is currently estimated at $221,005, approximately $214 per square foot. 31 Coventry Dr is a home located in Ross County with nearby schools including Unioto Elementary School, Unioto Middle School, and Unioto High School.
Ownership History
Date
Name
Owned For
Owner Type
Purchase Details
Closed on
Jun 12, 2020
Sold by
Welch Scott M and Welch Jaime L
Bought by
Stanley Natalie
Current Estimated Value
Home Financials for this Owner
Home Financials are based on the most recent Mortgage that was taken out on this home.
Original Mortgage
$115,900
Outstanding Balance
$102,736
Interest Rate
3.2%
Mortgage Type
New Conventional
Estimated Equity
$118,269
Purchase Details
Closed on
Apr 22, 2005
Sold by
Detillion Rodney O
Bought by
Welch Scott M and Welch Jaime L
Home Financials for this Owner
Home Financials are based on the most recent Mortgage that was taken out on this home.
Original Mortgage
$95,501
Interest Rate
6.06%
Mortgage Type
FHA
Purchase Details
Closed on
Mar 17, 2005
Sold by
Detillion Teresa L
Bought by
Detillin Rodney O
Home Financials for this Owner
Home Financials are based on the most recent Mortgage that was taken out on this home.
Original Mortgage
$95,501
Interest Rate
6.06%
Mortgage Type
FHA
Create a Home Valuation Report for This Property
The Home Valuation Report is an in-depth analysis detailing your home's value as well as a comparison with similar homes in the area
Home Values in the Area
Average Home Value in this Area
Purchase History
| Date | Buyer | Sale Price | Title Company |
|---|---|---|---|
| Stanley Natalie | $122,000 | Chicago Title Agency | |
| Welch Scott M | $97,000 | None Available | |
| Detillin Rodney O | -- | None Available |
Source: Public Records
Mortgage History
| Date | Status | Borrower | Loan Amount |
|---|---|---|---|
| Open | Stanley Natalie | $115,900 | |
| Previous Owner | Welch Scott M | $95,501 |
Source: Public Records
Tax History
| Year | Tax Paid | Tax Assessment Tax Assessment Total Assessment is a certain percentage of the fair market value that is determined by local assessors to be the total taxable value of land and additions on the property. | Land | Improvement |
|---|---|---|---|---|
| 2024 | $1,952 | $52,410 | $6,190 | $46,220 |
| 2023 | $1,952 | $52,410 | $6,190 | $46,220 |
| 2022 | $1,991 | $52,410 | $6,190 | $46,220 |
| 2021 | $1,445 | $37,720 | $4,550 | $33,170 |
| 2020 | $1,453 | $37,720 | $4,550 | $33,170 |
| 2019 | $1,433 | $37,720 | $4,550 | $33,170 |
| 2018 | $1,334 | $34,360 | $4,550 | $29,810 |
| 2017 | $1,308 | $34,360 | $4,550 | $29,810 |
| 2016 | $1,285 | $34,360 | $4,550 | $29,810 |
| 2015 | $1,164 | $31,210 | $4,550 | $26,660 |
| 2014 | $1,135 | $31,210 | $4,550 | $26,660 |
| 2013 | $1,141 | $31,210 | $4,550 | $26,660 |
Source: Public Records
Map
Nearby Homes
- 1437 Valley Dr
- 17 Briarcliff Dr
- 1310 Western Ave
- 1295 Randall Ct
- 1271 Porter Dr
- 4 Becky Ln
- 94 Applewood Dr
- 44 Banyas Blvd
- 194 Plyleys Ln
- 15 Shawnee Dr
- 10 Overlook Dr
- 9 Overlook Dr
- 27 Shawnee Dr
- 1041 Edgewood Dr
- 239 Almahurst Dr
- 240 Independence Dr Unit B10
- 320 Summerhill Dr
- 231 Saint Claire Dr
- 4 Ridge Dr
- 18 Ridge Dr
Your Personal Tour Guide
Ask me questions while you tour the home.