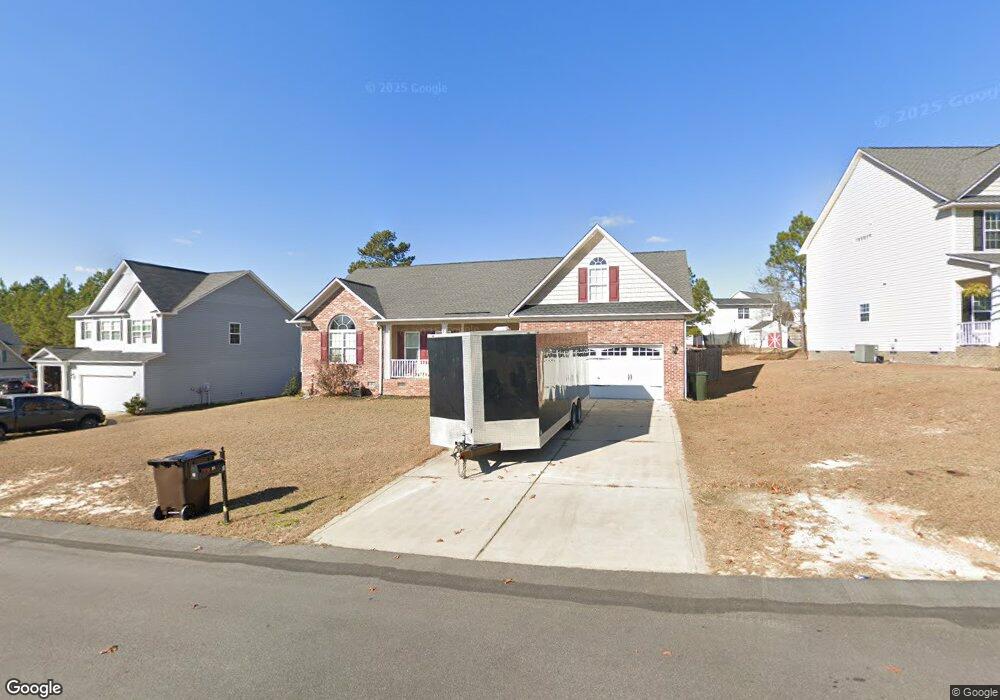
31 Craven St Spring Lake, NC 28390
Estimated Value: $270,000 - $297,000
3
Beds
2
Baths
1,957
Sq Ft
$147/Sq Ft
Est. Value
About This Home
This home is located at 31 Craven St, Spring Lake, NC 28390 and is currently estimated at $287,223, approximately $146 per square foot. 31 Craven St is a home located in Harnett County with nearby schools including Overhills Elementary School, Overhills Middle School, and Overhills High School.
Ownership History
Date
Name
Owned For
Owner Type
Purchase Details
Closed on
Feb 16, 2023
Sold by
Perez Pablo
Bought by
Campa Daniel A
Current Estimated Value
Home Financials for this Owner
Home Financials are based on the most recent Mortgage that was taken out on this home.
Original Mortgage
$270,389
Outstanding Balance
$261,905
Interest Rate
6.33%
Mortgage Type
VA
Estimated Equity
$25,318
Purchase Details
Closed on
Jul 8, 2021
Sold by
Gonzales Joseph P
Bought by
Perez Pablo and Perez Charllene
Home Financials for this Owner
Home Financials are based on the most recent Mortgage that was taken out on this home.
Original Mortgage
$233,000
Interest Rate
2.7%
Mortgage Type
VA
Purchase Details
Closed on
Jul 21, 2010
Sold by
Southern Built Homes Llc
Bought by
Gonzales Joseph P
Home Financials for this Owner
Home Financials are based on the most recent Mortgage that was taken out on this home.
Original Mortgage
$187,902
Interest Rate
4.73%
Mortgage Type
VA
Create a Home Valuation Report for This Property
The Home Valuation Report is an in-depth analysis detailing your home's value as well as a comparison with similar homes in the area
Home Values in the Area
Average Home Value in this Area
Purchase History
| Date | Buyer | Sale Price | Title Company |
|---|---|---|---|
| Campa Daniel A | $280,000 | -- | |
| Perez Pablo | $240,000 | None Available | |
| Gonzales Joseph P | $182,000 | -- |
Source: Public Records
Mortgage History
| Date | Status | Borrower | Loan Amount |
|---|---|---|---|
| Open | Campa Daniel A | $270,389 | |
| Previous Owner | Perez Pablo | $233,000 | |
| Previous Owner | Gonzales Joseph P | $187,902 |
Source: Public Records
Tax History Compared to Growth
Tax History
| Year | Tax Paid | Tax Assessment Tax Assessment Total Assessment is a certain percentage of the fair market value that is determined by local assessors to be the total taxable value of land and additions on the property. | Land | Improvement |
|---|---|---|---|---|
| 2025 | $1,715 | $232,592 | $0 | $0 |
| 2024 | $1,715 | $232,592 | $0 | $0 |
| 2023 | $1,400 | $232,592 | $0 | $0 |
| 2022 | $1,565 | $232,592 | $0 | $0 |
| 2021 | $1,565 | $172,120 | $0 | $0 |
| 2020 | $1,565 | $172,120 | $0 | $0 |
| 2019 | $1,550 | $172,120 | $0 | $0 |
| 2018 | $1,550 | $172,120 | $0 | $0 |
| 2017 | $1,550 | $172,120 | $0 | $0 |
| 2016 | $1,580 | $175,570 | $0 | $0 |
| 2015 | $1,580 | $175,570 | $0 | $0 |
| 2014 | $1,580 | $175,570 | $0 | $0 |
Source: Public Records
Map
Nearby Homes