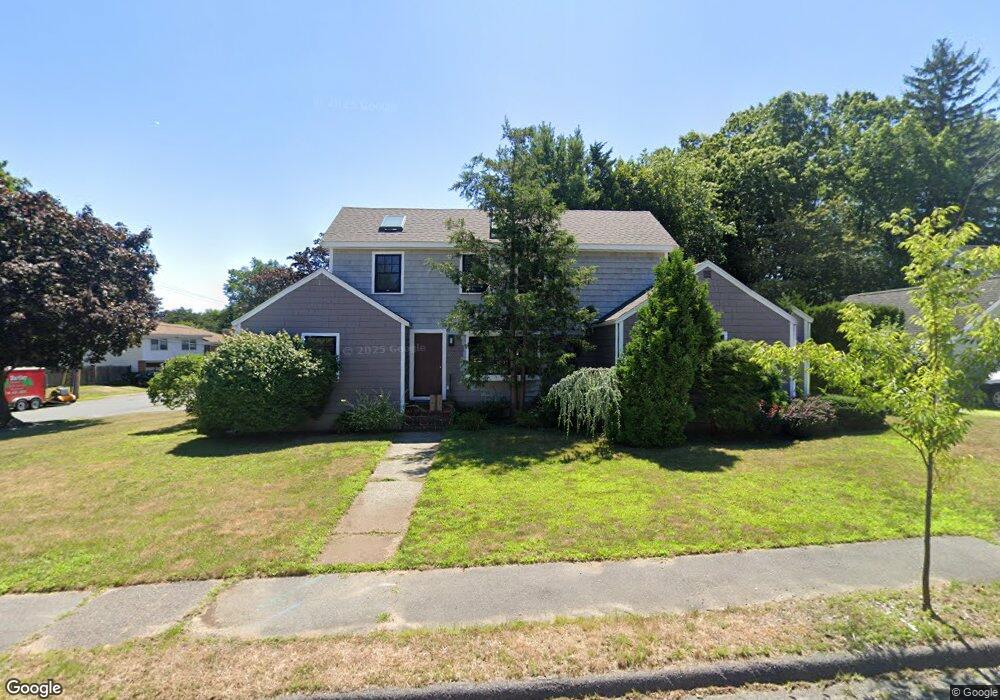
31 Dartmouth Rd Marblehead, MA 01945
Estimated Value: $771,261 - $820,000
3
Beds
2
Baths
1,364
Sq Ft
$576/Sq Ft
Est. Value
About This Home
This home is located at 31 Dartmouth Rd, Marblehead, MA 01945 and is currently estimated at $785,815, approximately $576 per square foot. 31 Dartmouth Rd is a home located in Essex County with nearby schools including Marblehead High School, Tower School, and Devereux School.
Ownership History
Date
Name
Owned For
Owner Type
Purchase Details
Closed on
Oct 8, 2009
Sold by
Homan John W and Homan Christopher D
Bought by
Cronin Kathryn E
Current Estimated Value
Home Financials for this Owner
Home Financials are based on the most recent Mortgage that was taken out on this home.
Original Mortgage
$358,388
Interest Rate
5.14%
Mortgage Type
Purchase Money Mortgage
Purchase Details
Closed on
Aug 28, 2008
Sold by
Homan Maureen E
Bought by
Homan John W
Create a Home Valuation Report for This Property
The Home Valuation Report is an in-depth analysis detailing your home's value as well as a comparison with similar homes in the area
Home Values in the Area
Average Home Value in this Area
Purchase History
| Date | Buyer | Sale Price | Title Company |
|---|---|---|---|
| Cronin Kathryn E | $365,000 | -- | |
| Cronin Kathryn E | $365,000 | -- | |
| Homan John W | -- | -- | |
| Homan John W | -- | -- |
Source: Public Records
Mortgage History
| Date | Status | Borrower | Loan Amount |
|---|---|---|---|
| Open | Homan John W | $340,000 | |
| Closed | Homan John W | $358,388 |
Source: Public Records
Tax History Compared to Growth
Tax History
| Year | Tax Paid | Tax Assessment Tax Assessment Total Assessment is a certain percentage of the fair market value that is determined by local assessors to be the total taxable value of land and additions on the property. | Land | Improvement |
|---|---|---|---|---|
| 2025 | $6,988 | $772,100 | $592,700 | $179,400 |
| 2024 | $6,429 | $717,500 | $605,900 | $111,600 |
| 2023 | $6,451 | $645,100 | $533,500 | $111,600 |
| 2022 | $6,258 | $594,900 | $474,200 | $120,700 |
| 2021 | $5,937 | $569,800 | $447,800 | $122,000 |
| 2020 | $5,560 | $535,100 | $447,800 | $87,300 |
| 2019 | $5,323 | $495,600 | $408,300 | $87,300 |
| 2018 | $5,172 | $469,300 | $382,000 | $87,300 |
| 2017 | $5,022 | $456,100 | $368,800 | $87,300 |
| 2016 | $4,814 | $433,700 | $342,500 | $91,200 |
| 2015 | $4,221 | $381,000 | $289,800 | $91,200 |
| 2014 | $3,904 | $352,000 | $263,400 | $88,600 |
Source: Public Records
Map
Nearby Homes
- 30 Amherst Rd
- 34 Lafayette St
- 3 Oak St
- 282 Pleasant St
- 6 Higgins Rd
- 2 Martin St
- 70 Maverick St
- 83 Lafayette St
- 100 Village St
- 197A W Shore Dr Unit A
- 29 Village St Unit 1
- 155 Village St
- 12 Heritage Way Unit 12
- 25 Tedesco St
- 41 Rowland St
- 215 W Shore Dr
- 24-26 Knight Ave
- 66 Jersey St
- 290 Washington St Unit 3
- 290 Washington St Unit 2