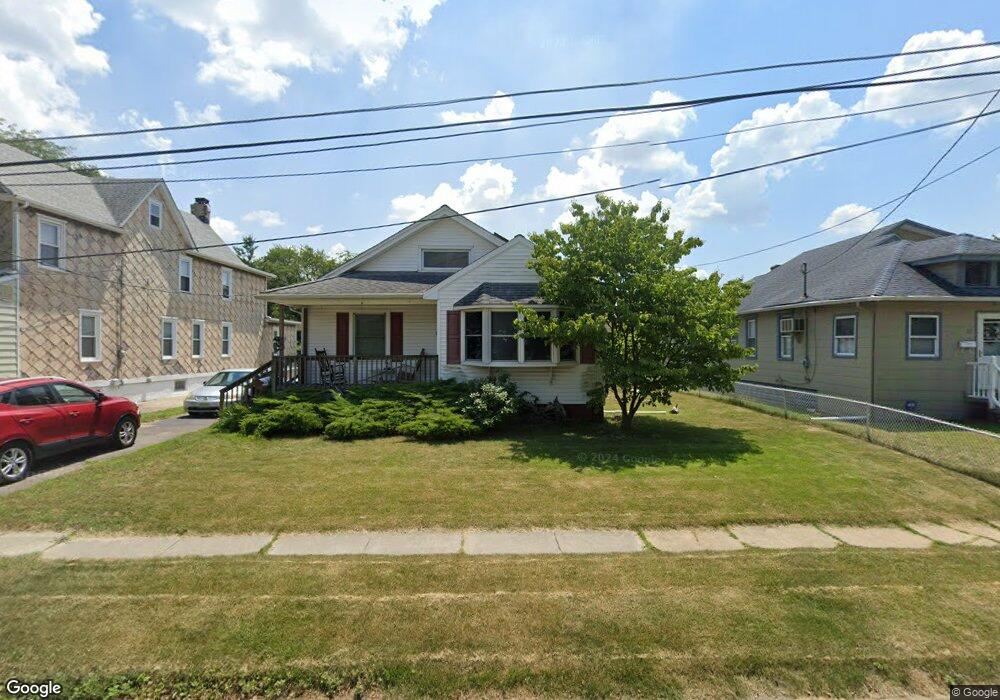
31 Delaware View Ave Westville, NJ 08093
Estimated Value: $260,000 - $315,000
Studio
--
Bath
1,641
Sq Ft
$175/Sq Ft
Est. Value
About This Home
This home is located at 31 Delaware View Ave, Westville, NJ 08093 and is currently estimated at $287,122, approximately $174 per square foot. 31 Delaware View Ave is a home located in Gloucester County with nearby schools including Parkview Elementary School, Gateway Regional High School, and Gloucester Catholic Junior Senior High School.
Ownership History
Date
Name
Owned For
Owner Type
Purchase Details
Closed on
Dec 17, 2009
Sold by
Adels Henry J and Adels Nancy H
Bought by
Adels Henry J and Adels Nancy H
Current Estimated Value
Purchase Details
Closed on
Apr 30, 2007
Sold by
Jacurak Marc S and Roseberry Lynne C
Bought by
Adels Henry J and Adels Nancy H
Purchase Details
Closed on
Aug 23, 2002
Sold by
Hadden William H and Hadden Carol
Bought by
Jacurak Marc S and Roseberry Lynne C
Home Financials for this Owner
Home Financials are based on the most recent Mortgage that was taken out on this home.
Original Mortgage
$100,383
Interest Rate
6.55%
Mortgage Type
FHA
Purchase Details
Closed on
Apr 12, 2002
Sold by
Kearney Kay E and Nessler Kathy A
Bought by
Hadden William H and Hadden Carol J
Home Financials for this Owner
Home Financials are based on the most recent Mortgage that was taken out on this home.
Original Mortgage
$74,815
Interest Rate
6.84%
Create a Home Valuation Report for This Property
The Home Valuation Report is an in-depth analysis detailing your home's value as well as a comparison with similar homes in the area
Purchase History
| Date | Buyer | Sale Price | Title Company |
|---|---|---|---|
| Adels Henry J | -- | None Available | |
| Adels Henry J | $188,000 | None Available | |
| Jacurak Marc S | $102,000 | Surety Title Corporation | |
| Hadden William H | $81,900 | -- |
Source: Public Records
Mortgage History
| Date | Status | Borrower | Loan Amount |
|---|---|---|---|
| Previous Owner | Jacurak Marc S | $100,383 | |
| Previous Owner | Hadden William H | $74,815 |
Source: Public Records
Tax History
| Year | Tax Paid | Tax Assessment Tax Assessment Total Assessment is a certain percentage of the fair market value that is determined by local assessors to be the total taxable value of land and additions on the property. | Land | Improvement |
|---|---|---|---|---|
| 2025 | $7,106 | $130,600 | $47,000 | $83,600 |
| 2024 | $6,879 | $130,600 | $47,000 | $83,600 |
Source: Public Records
Map
Nearby Homes
- 37 Delaware View Ave
- 25 Delaware View Ave
- 641 Summit Ave
- 637 Summit Ave
- 19 Delaware View Ave
- 633 Summit Ave
- 15 Delaware View Ave
- 640 Summit Ave
- 625 Summit Ave
- 636 Summit Ave
- 628 River Dr
- 632 River Dr
- 632 Summit Ave
- 636 River Dr
- 640 River Dr
- 624 River Dr
- 626 Summit Ave
- 617 Summit Ave
- 620 River Dr
- 620 Summit Ave
Your Personal Tour Guide
Ask me questions while you tour the home.