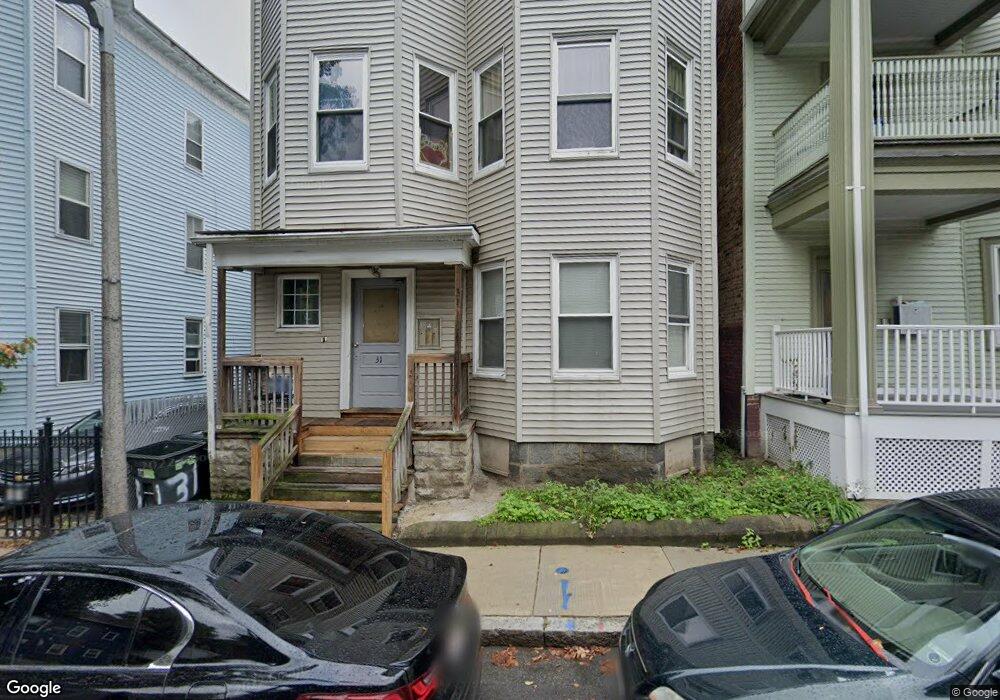
31 Dunreath St Roxbury, MA 02119
Sav-Mor NeighborhoodEstimated Value: $927,724 - $1,155,000
6
Beds
3
Baths
4,206
Sq Ft
$241/Sq Ft
Est. Value
About This Home
This home is located at 31 Dunreath St, Roxbury, MA 02119 and is currently estimated at $1,014,931, approximately $241 per square foot. 31 Dunreath St is a home located in Suffolk County with nearby schools including Bridge Boston Charter School, Dudley Street Neighborhood Charter School, and City on a Hill Charter Public School.
Ownership History
Date
Name
Owned For
Owner Type
Purchase Details
Closed on
Apr 24, 2003
Sold by
Evans Lenzer J and Evans Geraldine R
Bought by
Reid Edward
Current Estimated Value
Home Financials for this Owner
Home Financials are based on the most recent Mortgage that was taken out on this home.
Original Mortgage
$297,100
Interest Rate
5.64%
Mortgage Type
Purchase Money Mortgage
Create a Home Valuation Report for This Property
The Home Valuation Report is an in-depth analysis detailing your home's value as well as a comparison with similar homes in the area
Home Values in the Area
Average Home Value in this Area
Purchase History
| Date | Buyer | Sale Price | Title Company |
|---|---|---|---|
| Reid Edward | $371,400 | -- |
Source: Public Records
Mortgage History
| Date | Status | Borrower | Loan Amount |
|---|---|---|---|
| Open | Reid Edward | $400,000 | |
| Closed | Reid Edward | $297,100 | |
| Closed | Reid Edward | $55,700 |
Source: Public Records
Tax History Compared to Growth
Tax History
| Year | Tax Paid | Tax Assessment Tax Assessment Total Assessment is a certain percentage of the fair market value that is determined by local assessors to be the total taxable value of land and additions on the property. | Land | Improvement |
|---|---|---|---|---|
| 2025 | $9,292 | $802,400 | $190,000 | $612,400 |
| 2024 | $7,956 | $729,900 | $183,000 | $546,900 |
| 2023 | $7,466 | $695,200 | $174,300 | $520,900 |
| 2022 | $7,200 | $661,800 | $165,900 | $495,900 |
| 2021 | $6,725 | $630,300 | $158,000 | $472,300 |
| 2020 | $6,606 | $625,600 | $163,200 | $462,400 |
| 2019 | $5,887 | $558,500 | $117,300 | $441,200 |
| 2018 | $5,420 | $517,200 | $117,300 | $399,900 |
| 2017 | $5,477 | $517,200 | $117,300 | $399,900 |
| 2016 | $4,947 | $449,700 | $117,300 | $332,400 |
| 2015 | $4,731 | $390,700 | $83,200 | $307,500 |
| 2014 | $4,592 | $365,000 | $83,200 | $281,800 |
Source: Public Records
Map
Nearby Homes
- 33 Copeland Park Unit C
- 7 Langford Park Unit 3
- 30 Copeland St Unit 1
- 59 Perrin St
- 59 Perrin St Unit 1
- 22 Alaska St
- 80 Blue Hill Ave Unit 5
- 119 Blue Hill Ave
- 45 Woodville St
- 31 Alaska St
- 101 Mount Pleasant Ave
- 20 Rockville Park
- 22 Rockville Park
- 133 Blue Hill Ave
- 108 Mount Pleasant Ave Unit 108R
- 10 Rockland St Unit 4
- Lot 84 Blue Hill Ave
- 79 W Cottage St
- 62 Clifford St Unit A
- 12 Gayland St
- 31 Dunreath St Unit 1
- 29 Dunreath St
- 35 Dunreath St
- 27 Dunreath St
- 27 Dunreath St
- 27 Dunreath St Unit 3 BED 1 Bath Boston
- 39 Dunreath St
- 25 Dunreath St
- 54 Copeland St Unit 56
- 52 Copeland St
- 30 Dunreath St
- 30 Dunreath St Unit 1
- 30 Dunreath St Unit 1F
- 58-60 Copeland St Unit C
- 58-60 Copeland St
- 58-60 Copeland St Unit B
- 58-60 Copeland St Unit A
- 58-60 Copeland St Unit 2
- 58-60 Copeland St Unit 3
- 58-60 Copeland St Unit 1