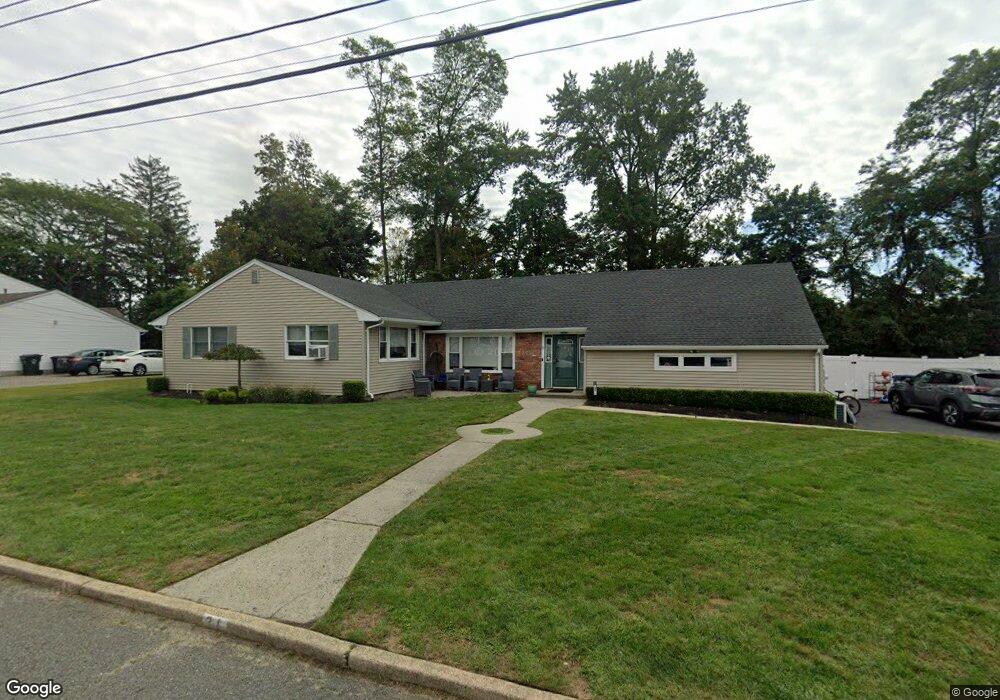
31 Dwight Dr Ocean, NJ 07712
Wanamassa NeighborhoodEstimated Value: $1,147,004 - $1,236,000
4
Beds
3
Baths
2,309
Sq Ft
$520/Sq Ft
Est. Value
About This Home
This home is located at 31 Dwight Dr, Ocean, NJ 07712 and is currently estimated at $1,200,751, approximately $520 per square foot. 31 Dwight Dr is a home located in Monmouth County with nearby schools including Ocean Township High School, St. Mary of the Assumption School, and Bnot Shirah of Deal.
Ownership History
Date
Name
Owned For
Owner Type
Purchase Details
Closed on
Jun 30, 1998
Sold by
Hyman Laniado
Bought by
Zalta Nathan
Current Estimated Value
Home Financials for this Owner
Home Financials are based on the most recent Mortgage that was taken out on this home.
Original Mortgage
$171,000
Outstanding Balance
$35,116
Interest Rate
7.04%
Estimated Equity
$1,165,635
Purchase Details
Closed on
Sep 23, 1994
Sold by
Tagliabue Robert
Bought by
Hyman Laniado and Laniado Sarah
Home Financials for this Owner
Home Financials are based on the most recent Mortgage that was taken out on this home.
Original Mortgage
$154,000
Interest Rate
8.5%
Create a Home Valuation Report for This Property
The Home Valuation Report is an in-depth analysis detailing your home's value as well as a comparison with similar homes in the area
Home Values in the Area
Average Home Value in this Area
Purchase History
| Date | Buyer | Sale Price | Title Company |
|---|---|---|---|
| Zalta Nathan | $227,500 | -- | |
| Hyman Laniado | $205,000 | -- |
Source: Public Records
Mortgage History
| Date | Status | Borrower | Loan Amount |
|---|---|---|---|
| Open | Zalta Nathan | $171,000 | |
| Previous Owner | Hyman Laniado | $154,000 |
Source: Public Records
Tax History
| Year | Tax Paid | Tax Assessment Tax Assessment Total Assessment is a certain percentage of the fair market value that is determined by local assessors to be the total taxable value of land and additions on the property. | Land | Improvement |
|---|---|---|---|---|
| 2025 | $13,985 | $1,038,800 | $790,500 | $248,300 |
| 2024 | $12,619 | $980,700 | $738,100 | $242,600 |
Source: Public Records
Map
Nearby Homes
- 514 Deal Rd
- 8 Ross Ct
- 25 Surrey Ln
- 35 Shadow Lawn Dr
- 909 Brookside Ave
- 221 Harrison Ave
- 1630 Finderne St
- 504 Crosby Ave
- 227 Chatham Ave
- 186 Whalepond Rd
- 130 Woolley Ct
- 489 Freehold St
- 2 Milwin Ct
- 4 Milwin Ct
- 709 Talmadge Ave
- 1125 Interlaken Ave
- 243 Woodcrest Rd
- 720 Talmadge Ave
- 197 Delaware Ave
- 201 Freehold St
Your Personal Tour Guide
Ask me questions while you tour the home.