Estimated Value: $597,000 - $787,000
4
Beds
1
Bath
1,200
Sq Ft
$578/Sq Ft
Est. Value
About This Home
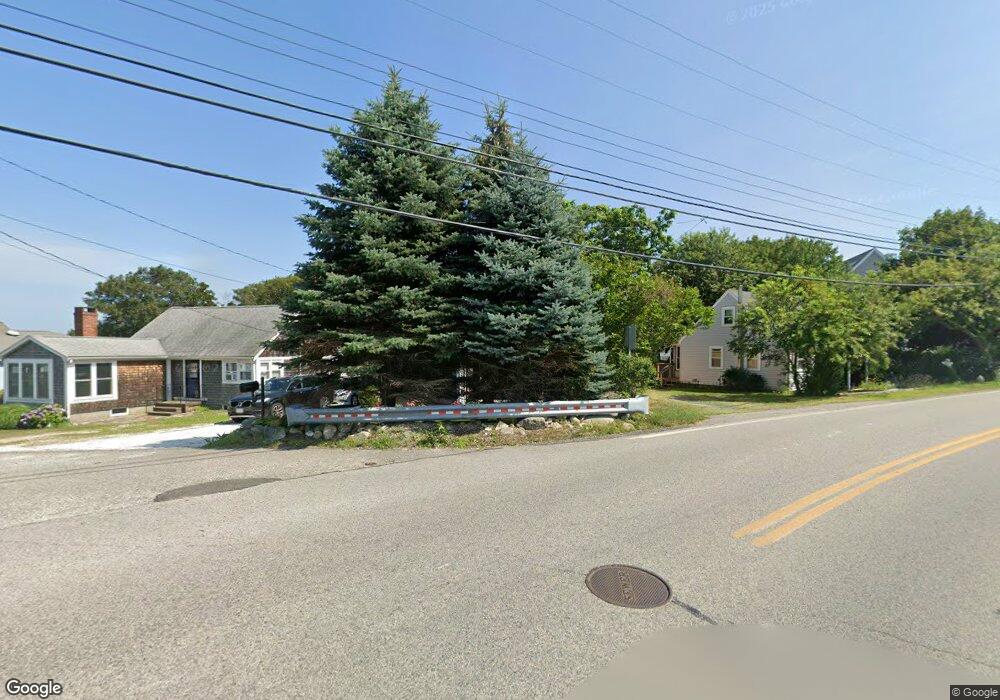
This home is located at 31 East St, Marshfield, MA 02050 and is currently estimated at $693,752, approximately $578 per square foot. 31 East St is a home located in Plymouth County with nearby schools including Daniel Webster, Furnace Brook Middle School, and Marshfield High School.
Ownership History
Date
Name
Owned For
Owner Type
Purchase Details
Closed on
Apr 30, 2025
Sold by
Kerns John and Holt-Kerns Janice A
Bought by
John Kerns Lt and Kerns
Current Estimated Value
Purchase Details
Closed on
Jul 26, 1991
Sold by
Brennan Marie
Bought by
Kerns John and Holt Kenneth G
Create a Home Valuation Report for This Property
The Home Valuation Report is an in-depth analysis detailing your home's value as well as a comparison with similar homes in the area
Home Values in the Area
Average Home Value in this Area
Purchase History
| Date | Buyer | Sale Price | Title Company |
|---|---|---|---|
| John Kerns Lt | -- | None Available | |
| Kerns John | $119,900 | -- |
Source: Public Records
Mortgage History
| Date | Status | Borrower | Loan Amount |
|---|---|---|---|
| Previous Owner | Kerns John | $222,000 | |
| Previous Owner | Kerns John | $177,000 | |
| Previous Owner | Kerns John | $207,200 |
Source: Public Records
Tax History Compared to Growth
Tax History
| Year | Tax Paid | Tax Assessment Tax Assessment Total Assessment is a certain percentage of the fair market value that is determined by local assessors to be the total taxable value of land and additions on the property. | Land | Improvement |
|---|---|---|---|---|
| 2025 | $5,419 | $547,400 | $377,100 | $170,300 |
| 2024 | $5,328 | $512,800 | $357,300 | $155,500 |
| 2023 | $4,688 | $445,000 | $309,600 | $135,400 |
| 2022 | $4,688 | $362,000 | $248,100 | $113,900 |
| 2021 | $4,610 | $349,500 | $248,100 | $101,400 |
| 2020 | $4,659 | $349,500 | $248,100 | $101,400 |
| 2019 | $4,587 | $342,800 | $248,100 | $94,700 |
| 2018 | $3,988 | $298,300 | $208,400 | $89,900 |
| 2017 | $3,950 | $287,900 | $208,400 | $79,500 |
| 2016 | $3,943 | $284,100 | $208,400 | $75,700 |
| 2015 | $3,644 | $274,200 | $198,500 | $75,700 |
| 2014 | $3,713 | $279,400 | $208,400 | $71,000 |
Source: Public Records
Map
Nearby Homes