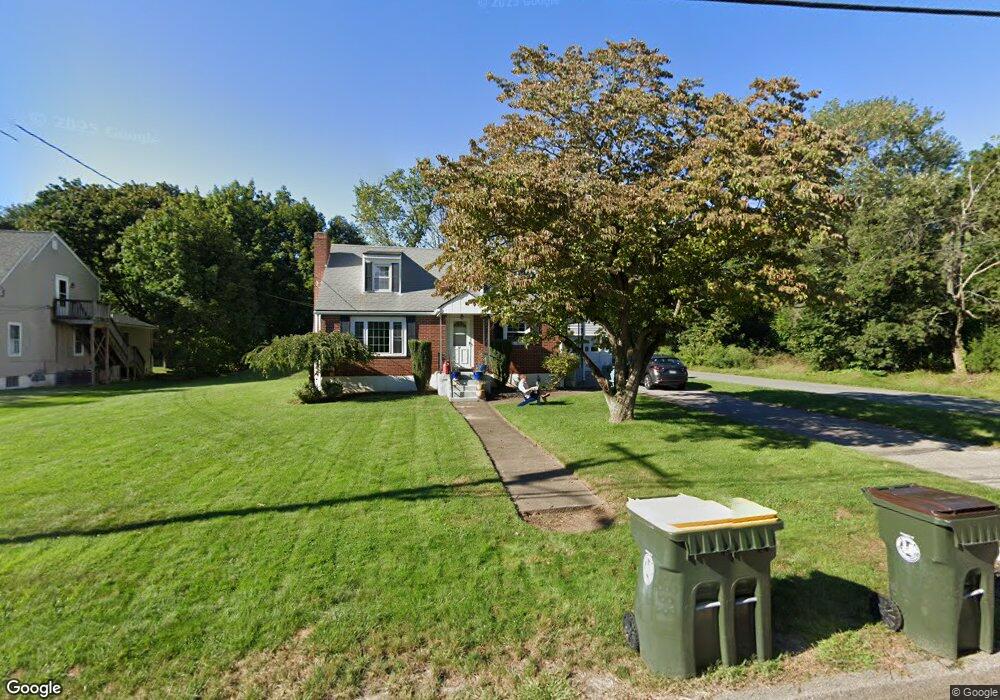
31 Elm St Bellingham, MA 02019
Estimated Value: $472,000 - $493,000
4
Beds
1
Bath
1,344
Sq Ft
$359/Sq Ft
Est. Value
About This Home
This home is located at 31 Elm St, Bellingham, MA 02019 and is currently estimated at $482,393, approximately $358 per square foot. 31 Elm St is a home located in Norfolk County with nearby schools including Joseph F. DiPietro Elementary, Bellingham High School, and Rise Prep Mayoral Academy Middle School.
Ownership History
Date
Name
Owned For
Owner Type
Purchase Details
Closed on
Jul 18, 2025
Sold by
Omara Christopher R
Bought by
Sochacki Daniel and Sochacki Samantha
Current Estimated Value
Home Financials for this Owner
Home Financials are based on the most recent Mortgage that was taken out on this home.
Original Mortgage
$435,000
Outstanding Balance
$434,263
Interest Rate
6.85%
Mortgage Type
New Conventional
Estimated Equity
$48,130
Purchase Details
Closed on
Sep 12, 2020
Sold by
Shirley Downey Irt and Berry
Bought by
Omara Christopher R
Home Financials for this Owner
Home Financials are based on the most recent Mortgage that was taken out on this home.
Original Mortgage
$281,300
Interest Rate
2.8%
Mortgage Type
New Conventional
Purchase Details
Closed on
Mar 30, 2011
Sold by
Downey Shirley S
Bought by
Shirley Downey Irt and Berry
Purchase Details
Closed on
Aug 15, 1964
Bought by
Shirley Downey Irt
Create a Home Valuation Report for This Property
The Home Valuation Report is an in-depth analysis detailing your home's value as well as a comparison with similar homes in the area
Home Values in the Area
Average Home Value in this Area
Purchase History
| Date | Buyer | Sale Price | Title Company |
|---|---|---|---|
| Sochacki Daniel | $485,000 | -- | |
| Sochacki Daniel | $485,000 | -- | |
| Omara Christopher R | $290,000 | None Available | |
| Omara Christopher R | $290,000 | None Available | |
| Shirley Downey Irt | -- | -- | |
| Shirley Downey Irt | -- | -- | |
| Shirley Downey Irt | -- | -- |
Source: Public Records
Mortgage History
| Date | Status | Borrower | Loan Amount |
|---|---|---|---|
| Open | Sochacki Daniel | $435,000 | |
| Closed | Sochacki Daniel | $435,000 | |
| Previous Owner | Omara Christopher R | $281,300 |
Source: Public Records
Tax History Compared to Growth
Tax History
| Year | Tax Paid | Tax Assessment Tax Assessment Total Assessment is a certain percentage of the fair market value that is determined by local assessors to be the total taxable value of land and additions on the property. | Land | Improvement |
|---|---|---|---|---|
| 2025 | $4,510 | $359,100 | $130,500 | $228,600 |
| 2024 | $4,340 | $337,500 | $119,100 | $218,400 |
| 2023 | $4,184 | $320,600 | $113,400 | $207,200 |
| 2022 | $4,094 | $290,800 | $94,600 | $196,200 |
| 2021 | $3,950 | $274,100 | $94,600 | $179,500 |
| 2020 | $3,568 | $250,900 | $94,600 | $156,300 |
| 2019 | $3,493 | $245,800 | $94,600 | $151,200 |
| 2018 | $3,309 | $229,600 | $95,400 | $134,200 |
| 2017 | $3,225 | $224,900 | $95,400 | $129,500 |
| 2016 | $3,157 | $220,900 | $99,300 | $121,600 |
| 2015 | $3,030 | $212,600 | $95,400 | $117,200 |
| 2014 | $3,027 | $206,500 | $92,100 | $114,400 |
Source: Public Records
Map
Nearby Homes